This topic is about Flexible Asset Allocation, a concept I first got wind of thanks to this blog.(1)
Thanks to input from David Varadi of CSS Analytics, I have also extended this algorithm by injecting a better correlation ranking system, available in my IKTrading package on my Github.
Finally, thanks to input from the paper’s authors, I updated the algorithm to allocate weights before dropping assets with a negative momentum. The results show marginal improvement, which was covered in a recent blog post of mine.
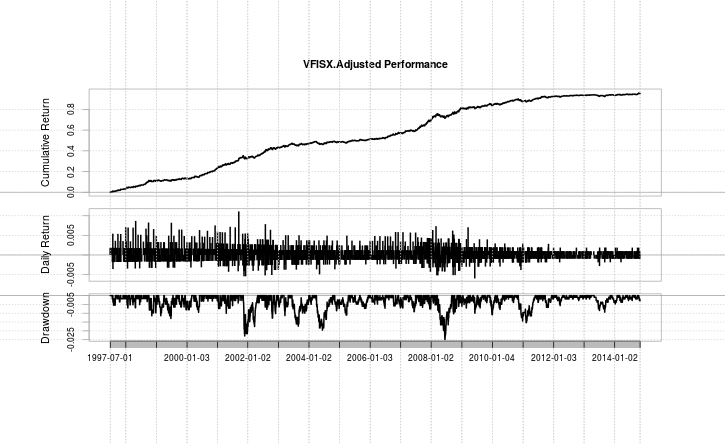
However, one other phenomenon pointed out to me by one of my readers, Mr. Helmuth Vollmeier, a multi-decade industry veteran, is that in a significant number of instances, the FAA algorithm will have a tie in rankings, with one of the top three rankings (as per the paper) belonging to the risk-free, cash security, in this case, VFISX. From the perspective of a standalone asset, VFISX has a very strong risk to reward ratio, with the following statistics, from the beginning of 1998 to Oct. 30, 2014:
Annualized Return: 3.94%
Annualized Sharpe Ratio (Rf=0%): 1.70%
Furthermore, here is its equity curve and drawdown profile:
The results are hypothetical results and are NOT an indicator of future results and do NOT represent returns that any investor actually attained. Indexes are unmanaged, do not reflect management or trading fees, and one cannot invest directly in an index. Additional information regarding the construction of these results is available upon request.
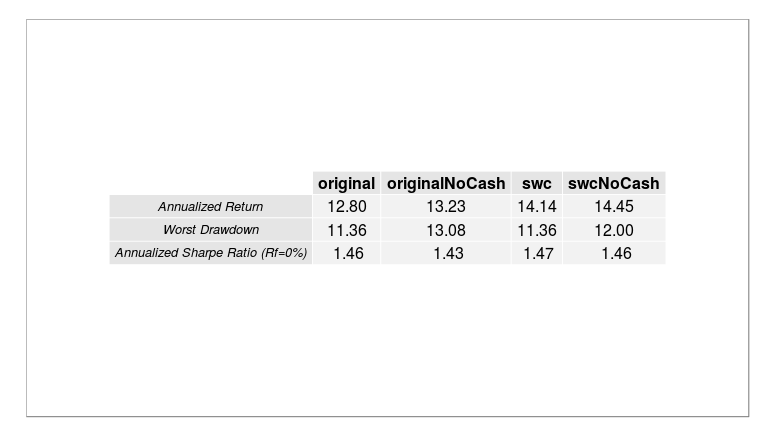
Overall, the performance is solid from a risk/reward ratio profile, but the returns are relatively low, as we would expect for a risk-free asset. Therefore, in the event of a tie, one interpretation is that by investing in the risk-free asset, one effectively “keeps money off the table.” Is this the correct interpretation? Well, here are the results using the original seven assets from the paper, tested from the start of 1998 to October 30, 2014.
The results are hypothetical results and are NOT an indicator of future results and do NOT represent returns that any investor actually attained. Indexes are unmanaged, do not reflect management or trading fees, and one cannot invest directly in an index. Additional information regarding the construction of these results is available upon request.
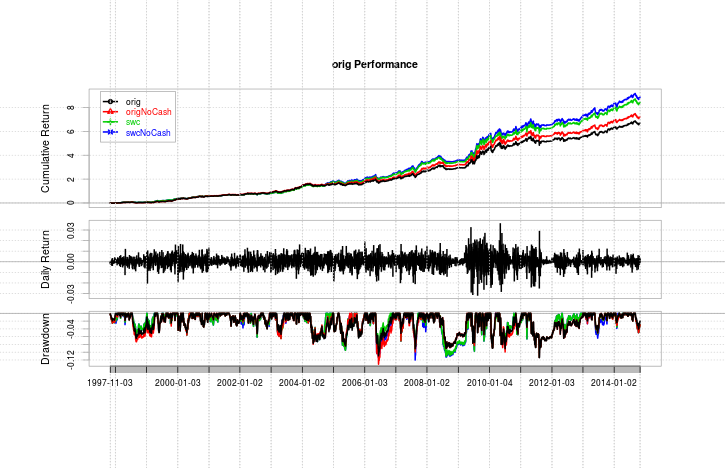
Here is an invested growth chart, along with drawdowns:
The results are hypothetical results and are NOT an indicator of future results and do NOT represent returns that any investor actually attained. Indexes are unmanaged, do not reflect management or trading fees, and one cannot invest directly in an index. Additional information regarding the construction of these results is available upon request.
In short, the results seem rather intuitive. By removing a high reward to risk instrument in the event of ties, we increase our overall returns, but pay for it with a slightly worse downside risk. At the end of the day, the tradeoff appears to be a case of splitting hairs (at least when not accounting for commissions and slippage), as the profiles basically overlap when applying the stepwise correlation rank algorithm, which produces a superior result than using a one-pass correlation matrix ranking.
I will release a corresponding blog post on my own blog as an appendix containing the functions and code used to generate the results, for those actually interested in the formal R programming.
Thanks for reading.
Ilya Kipnis is the author of QuantStrat TradeR. We like the work he does on his blog and his willingness to share his source code on various algorithms with the public. We asked Ilya if he’d be interested in sharing some of his recent insights…
For informational and educational purposes only and should not be construed as specific investment, accounting, legal, or tax advice. Certain information is deemed to be reliable, but its accuracy and completeness cannot be guaranteed. Third party information may become outdated or otherwise superseded without notice. Neither the Securities and Exchange Commission (SEC) nor any other federal or state agency has approved, determined the accuracy, or confirmed the adequacy of this article.
The views and opinions expressed herein are those of the author and do not necessarily reflect the views of Alpha Architect, its affiliates or its employees. Our full disclosures are available here. Definitions of common statistics used in our analysis are available here (towards the bottom).