The Joint Cross Section of Stocks and Options
- An, Ang, Bali and Cakici
- A version of the paper can be found here.
- Want a summary of academic papers with alpha? Check out our Academic Research Recap Category!
Abstract:
Stocks with large increases in call (put) implied volatilities over the previous month tend to have high (low) future returns. Sorting stocks ranked into decile portfolios by past call implied volatilities produces spreads in average returns of approximately 1% per month, and the return differences persist up to six months. The cross section of stock returns also predicts option-implied volatilities, with stocks with high past returns tending to have call and put option contracts that exhibit increases in implied volatility over the next month, but with decreasing realized volatility. These predictability patterns are consistent with rational models of informed trading.
Alpha Highlight:
Observed changes in the implied volatilities of options can be considered a good measure of news arrival in the option market. Additionally, if some informed investors trade in option markets before trading in the underlying stock, option prices might predict future stock price movements. Indeed, this study finds that changes in option implied volatilities are correlated with subsequent stock returns.
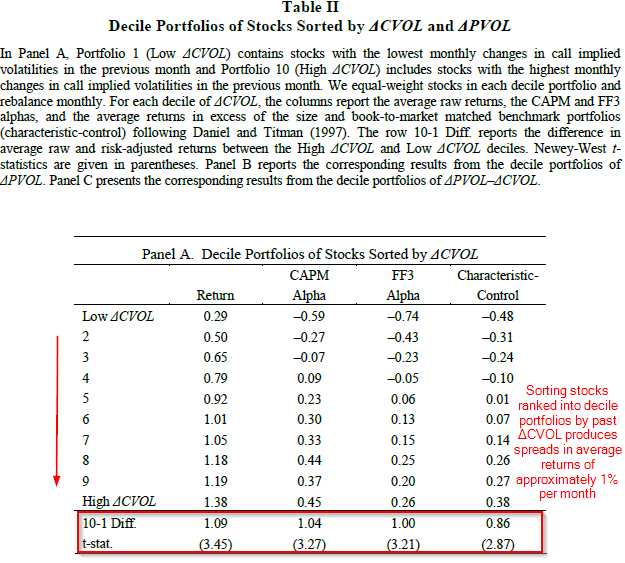
Portfolio returns are sorted based on changes in option implied volatilities. Panel A in the table below shows decile portfolios of stocks sorted by changes in implied volatility of call options, or ΔCVOL (Panel B based on ΔPVOL is omitted here).
- Portfolio 1 (Low ΔCVOL) contains stocks with the lowest changes in call option implied volatilities in the previous month;
- Portfolio 10 (High ΔCVOL) includes stocks with the highest changes in call option implied volatilities in the previous month.
The results show that a long/short strategy going long (short) stocks with call options with the highest (lowest) changes in implied volatilities earns returns of approximately 1% per month. Call option volatility appears to be a good predictor for future stock returns. Also, this predictability is persistent, lasting up to 6 months (see table V).
The results are hypothetical results and are NOT an indicator of future results and do NOT represent returns that any investor actually attained. Indexes are unmanaged, do not reflect management or trading fees, and one cannot invest directly in an index. Additional information regarding the construction of these results is available upon request.
Intriguingly, the paper also explores using both call and put option volatility, potentially to greater effect.

About the Author: Wesley Gray, PhD
—
Important Disclosures
For informational and educational purposes only and should not be construed as specific investment, accounting, legal, or tax advice. Certain information is deemed to be reliable, but its accuracy and completeness cannot be guaranteed. Third party information may become outdated or otherwise superseded without notice. Neither the Securities and Exchange Commission (SEC) nor any other federal or state agency has approved, determined the accuracy, or confirmed the adequacy of this article.
The views and opinions expressed herein are those of the author and do not necessarily reflect the views of Alpha Architect, its affiliates or its employees. Our full disclosures are available here. Definitions of common statistics used in our analysis are available here (towards the bottom).
Join thousands of other readers and subscribe to our blog.