Since the development of the CAPM, academic research has attempted to find models that increase the explanatory power of the cross-section of stock returns. We moved from the single-factor CAPM (market beta) to the three-factor Fama-French model (adding size and value), to the Carhart four-factor model (adding momentum), to Lu Zhang’s q-factor model (beta, size, investment, profitability), to the Fama-French five-factor (adding value to the q-factor model) and six-factor models (adding back value and momentum to the q-factor model). There have also been versions that use different metrics for profitability and value, and Stambaugh and Yuan’s mispricing (anomaly)-based model. Regardless of the model used, an anomaly for all models is that the empirical evidence demonstrates that stocks with high research and development (R&D) expenses have delivered a premium.
Research on the role of R&D expenditures, including the 2004 study “Valuation and Return Dynamics of New Ventures,” the 2020 studies “Mispricing or Risk Premium? An Explanation of the R&D-to-Market Anomaly” and “The R&D Anomaly: Risk or Mispricing?,” and the 2022 study “Corporate R&D and Stock Returns: International Evidence,” has found:
- There are economically significant increases in average returns to portfolios sorted on R&D expenditures.
- The R&D effect is not concentrated in either smaller or larger firms.
- The R&D anomaly cannot be explained by existing asset pricing models, including the relatively recent investment and profitability factors.
- R&D-intensive firms are associated with higher future operating performance, return volatility, and default likelihood—the R&D effect is closely related to risk-bearing. This conflicts with a mispricing (behavioral) story: Investors underappreciate the value of R&D, resulting in low prices and high future (realized) returns.
New Research
Sunil Wahal and Amit Goyal contribute to the literature with their January 2023 study, “R&D, Expected Profitability, and Expected Returns,” in which they examined the asset pricing implications of corporate R&D expenditures. Their data sample covered stocks on the NYSE, AMEX, and Nasdaq exchange and the period July 1975 (after the issuance of SFAS2, which requires firms to expense R&D in the year the expenditure is incurred) through December 2021. Here is a summary of their key findings:
- Adjusting for industry, high R&D firms had positive loadings on a cash-based operating profitability factor and zero alphas.
- Current R&D expenditures did not forecast asset growth.
- Current R&D expenditures forecasted future firm-level profitability at least three years and sometimes ten years into the future, establishing the channel by which R&D should show up in asset prices—expectations of future profitability. The evidence that R&D forecasted future profitability was even stronger in large stocks.
- The original versions of both the five-factor and q pricing models were unable to price for R&D expenditures, principally because their profitability factors did not account for accruals. However, using cash-based operating profitability “cleans up the models and eviscerates pricing errors.”
- It was unnecessary to capitalize R&D to reflect intangible investment in book values so long as expected profitability was explicitly recognized as a determinant of expected returns.
Large firms accounted for about 90 percent of market capitalization and about 80 percent of aggregate R&D.
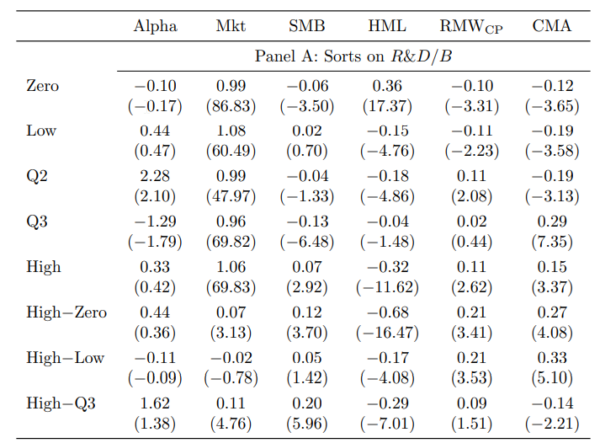
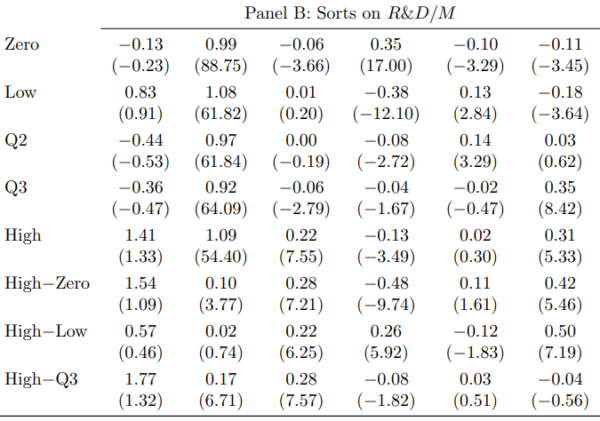
Table 5: Amended Five-Factor Model Regressions for R&D Sorted Portfolios We sort stocks at the end of each June based on their R&D to book equity ratio in Panel A and their R&D to market equity ratio in Panel B as in Table 3. R&D is calculated as described in the text. We industry adjust R&D/B and R&D/M using 2-digit SIC codes before sorting. Stocks with R&D/B = 0 and R&D/M = 0 and are placed in one group and the remaining stocks are sorted into quartiles based on breakpoints from NYSE stocks only. These quartiles are labeled Low, Q2, Q3, and High. The portfolios are value-weighted and rebalanced once every year at the end of June. The amended five-factor model replaces the RMW factor of Fama and French (2015) with RMWCP, the cash-based operating profitability factor of Ball, Gerakos, Linnainmaa, and Nikolaev (2016)). All alphas are reported in annualized percent. t-statistics are reported in parenthesis below alphas/loadings. The sample includes all stocks with positive sales at portfolio formation. The sample period is 1975 to 2021.
Their findings led Wahal and Goyal to conclude: “There is robust evidence that R&D fulfils its primary purpose of generating future profits, and does so over long horizons. In contrast, regressions of future investment on current R&D show no meaningful relation, regardless of the scaling variable (book or market equity) or horizon.”
Investor Takeaways
Supported by the findings of a significant positive relationship between R&D expenditures and future stock returns and the risk-based explanations for the R&D effect, the empirical research suggests a fundamentally important role of intellectual capital, specifically R&D, in asset pricing—the higher returns to high R&D stocks represent compensation for heightened systematic risk not captured in standard asset pricing models.
Unfortunately, the ability to interpret financial statements has been complicated by the dramatic shift from tangible investments (such as plant and equipment) to intangible investments (such as R&D, advertising and expenses related to human capital). The increasing role of intangibles is highlighted by the fact that that R&D expenditures increased from 1 percent of company expenditures in 1975 to 7.5 percent in 2018 and that in 2015, services’ share of GDP stood at 74 percent in high-income countries and just under 69 percent globally.
Given the shift in expenditures, it should not be a surprise that researchers, including the authors of the 2020 studies “Explaining the Recent Failure of Value Investing,” “Intangible Capital and the Value Factor: Has Your Value Definition Just Expired?” and “Equity Investing in the Age of Intangibles,” and the 2021 study “Value of Internally Generated Intangible Capital,” have focused attention on the impact on equity valuations and returns resulting from the change in the relative importance of intangible assets compared to physical assets.
The research has found that the increasing importance of intangibles, at least for industries with high concentrations of them, is playing an important role in the cross-section of returns. Thus, the role of intangibles should be addressed in portfolio construction because not accounting for them affects not just value metrics but other measures (e.g., profitability) that often scale by book value or total assets, both of which are affected by intangibles. Wahal and Goyal specifically recommend using cash profitability as a factor. A solution recommended and used by some investment management firms is to capitalize the investments on the income statement and amortize them over their useful lives. This means treating an intangible investment the same as a tangible investment. However, that raises questions such as: Which income statement items are appropriately considered investments? And what is a proper useful life for those assets?
In terms of the intensity of intangible assets, there is significant variance across industries. This is important for investors who rely predominately on multiples for valuation and for portfolio construction. Adjusting for intangibles can result in a large operating profit margin expansion for companies that are intangible-intensive, and insignificant changes for ones that are tangible-intensive. This suggests caution in comparing earnings or multiples across industries and over time.
Academics and fund managers have been trying to address the issues related to intangibles not being on the balance sheet through various methods. One method is to use alternatives to price-to-book (P/B) as the value metric, such as price-to-earnings (P/E), price-to-cash flow (P/CF) and enterprise value-to-earnings before interest, taxes, depreciation and amortization (EV/EBITDA). Many fund families (such as Alpha Architect, AQR, BlackRock, Bridgeway and Research Affiliates) use multiple value metrics (such as P/E, P/CF, P/S and EBITDA/EV), some of which indirectly provide exposure to the profitability factor. Another alternative is to add other factors into the definition of the eligible universe. For example, since 2013 Dimensional has included a sort for profitability in their value funds. A third alternative is to add back to book value an estimate of the value of intangible R&D and organizational expenses. A fourth way to address the issue is to apply what some call “contextual” stock selection, using different metrics or different weightings of those metrics depending on the intangible intensity. For example, if book value is not well specified for industries with high intangibles, it may be less effective in those industries than in industries with low intangibles.
At any rate, at least for most practitioners, the exclusive use of the traditional high-minus-low (HML) factor to build a value portfolio is no longer standard practice. None of the fund families my firm, Buckingham Strategic Wealth, uses in its portfolios exclusively use HML to construct its value funds.
Larry Swedroe is head of financial and economic research for Buckingham Wealth Partners. For informational and educational purposes only and should not be construed as specific investment, accounting, legal, or tax advice. Certain information is based upon third-party data and may become outdated or otherwise superseded without notice. Third-party information is deemed to be reliable, but its accuracy and completeness cannot be guaranteed. By clicking on any of the links above, you acknowledge that they are solely for your convenience, and do not necessarily imply any affiliations, sponsorships, endorsements or representations whatsoever by us regarding third-party websites. We are not responsible for the content, availability or privacy policies of these sites, and shall not be responsible or liable for any information, opinions, advice, products or services available on or through them. The opinions expressed by featured authors are their own and may not accurately reflect those of Buckingham Strategic Wealth® or Buckingham Strategic Partners®, collectively Buckingham Wealth Partners. Neither the Securities and Exchange Commission (SEC) nor any other federal or state agency have approved, determined the accuracy, or confirmed the adequacy of this article. LSR-22-457

About the Author: Larry Swedroe
—
Important Disclosures
For informational and educational purposes only and should not be construed as specific investment, accounting, legal, or tax advice. Certain information is deemed to be reliable, but its accuracy and completeness cannot be guaranteed. Third party information may become outdated or otherwise superseded without notice. Neither the Securities and Exchange Commission (SEC) nor any other federal or state agency has approved, determined the accuracy, or confirmed the adequacy of this article.
The views and opinions expressed herein are those of the author and do not necessarily reflect the views of Alpha Architect, its affiliates or its employees. Our full disclosures are available here. Definitions of common statistics used in our analysis are available here (towards the bottom).
Join thousands of other readers and subscribe to our blog.