Recently, we wrote two posts about how to combine Value and Momentum for stock selection purposes (Part 1 and Part 2). We followed this piece with a post on combining value and momentum for market timing purposes.
In this post, we review the use of combined Value and Momentum for both stock selection and market timing.
First, let’s examine the combination of Value and Momentum in stock selection. A concept that has been around for many years.
Setting Up a Value and Momentum Portfolio
First, let’s set up the experiment. We will examine all firms above the NYSE 40th percentile for market-cap (currently around $1.8 billion) to avoid weird empirical effects associated with micro/small cap stocks. We will form the portfolios at a monthly frequency with a 3-month holding period — so we use overlapping portfolios, a la Jagadeesh and Titman (1993). We focus on the following 2 variables:
- Momentum = Rank firms on three momentum variables: 3-month, 6-month, and 12-month momentum. The average of the 3 ranks is the “momentum” rank.
- Value = Rank firms on three value variables: EBIT/TEV, Book-to-Market (B/M), and E/P (inverse of P/E). The average of the 3 ranks is the “value” rank.
Every month, we select the top 100 Value stocks and the top 100 Momentum stocks (and hold them for 3 months). We then equal-weight the holdings.
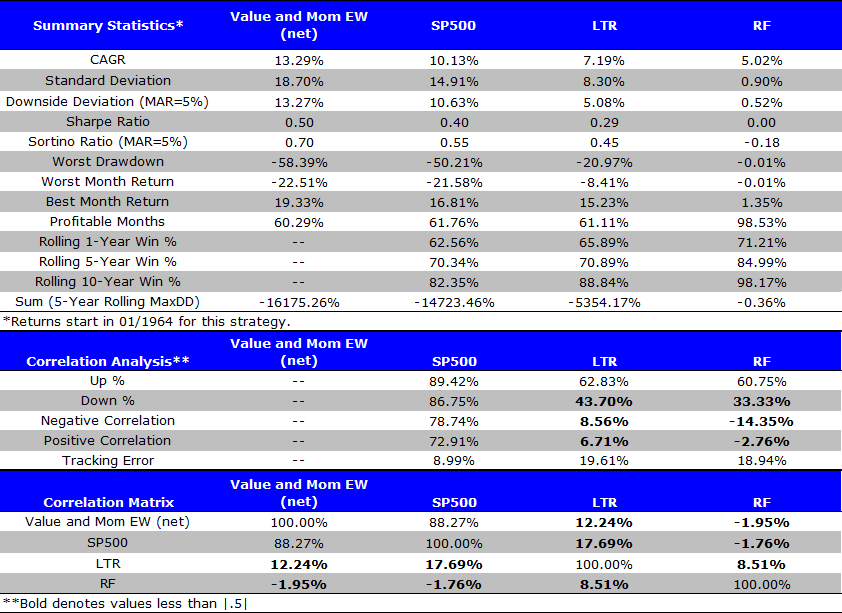
- Value and Mom EW (net) = Top 100 Value firms and Top 100 Momentum firms formed monthly and held for 3 months. Portfolio is equal-weighted. Returns are net of a 1.00% annual management fee and 2.00% annual transaction costs.
- SP500 = S&P 500 Total return
- LTR = Total Return to Merrill Lynch 7-10 year Government Bond Index
- RF = Total Return to Risk-Free Rate (U.S. T-Bills).
Results are net of a 1.00% annual management fee and 2.00% annual transaction costs. Index returns (S&P 500, LTR, and RF) are gross of any fees or transaction costs. All returns are total returns and include the reinvestment of distributions (e.g., dividends). Indexes are unmanaged, do not reflect management or trading fees, and one cannot invest directly in an index.
Results (1/1/1964-12/31/2014):
The results are hypothetical results and are NOT an indicator of future results and do NOT represent returns that any investor actually attained. Indexes are unmanaged, do not reflect management or trading fees, and one cannot invest directly in an index. Additional information regarding the construction of these results is available upon request.
Takeaways:
- Combining Value and Momentum outperformed the market (after fees) over the past 50 years. However, the Value and Momentum portfolio does have larger drawdowns and higher volatility than the passive index. On a risk-adjusted basis, the combination value/momentum portfolio is favorable.
Interesting, but active equity strategies have drawdown problems.
As previously discussed, we can examine what happens when we overlay a timing signal on top of the combination value and momentum stock selection system outlined above.
Below I describe the two market-timing rules:
Valuation-Based Signal:
We use 1/CAPE as the valuation metric, or the “earnings yield,” as a baseline indicator; however, we adjust the yield value for the realized year-over-year (yoy) inflation rate, by subtracting the year-over-year inflation rate from the rate of 1/CAPE. h.t., Gestaltu. A higher real yield spread is better than a low real yield spread.
To summarize, the metric looks as follows if the CAPE ratio is 20 and realized inflation (Inf) is 3%:
Real Yield Spread Metric = (1/20)-3% = 2%
Some details:
- Bureau of Labor Statistics (BLS) publishes the CPI on a monthly basis since 1913; however, the data is one-month lagged (possibly longer). For example, the CPI for January won’t be released until February. So when we subtract the year-over-year inflation rate from the rate of 1/CAPE, we do 1-month lag to avoid look-ahead bias.
- We use the S&P 500 Total Return index as a buy-and-hold benchmark.
- 80th Percentile Valuation based asset allocation: own Stocks when valuation < 80th percentile, otherwise hold risk-free.
- In other word, get out of the market if the real yield spread metric is extreme.
Momentum-based signal:
- Long-term moving average rule on the S&P 500 (own Stocks if above 12-month MA, risk-free if below the 12-month MA).
Using the Combination Signal:
Both signals are calculated using S&P 500 data (momentum and valuation). However, if the signals say we should be invested in stocks, we are invested in the Value and Momentum portfolio.
Results to all portfolios are net of a 1.00% annual management fee and 2.00% annual transaction costs. All returns are total returns and include the reinvestment of distributions (e.g., dividends).
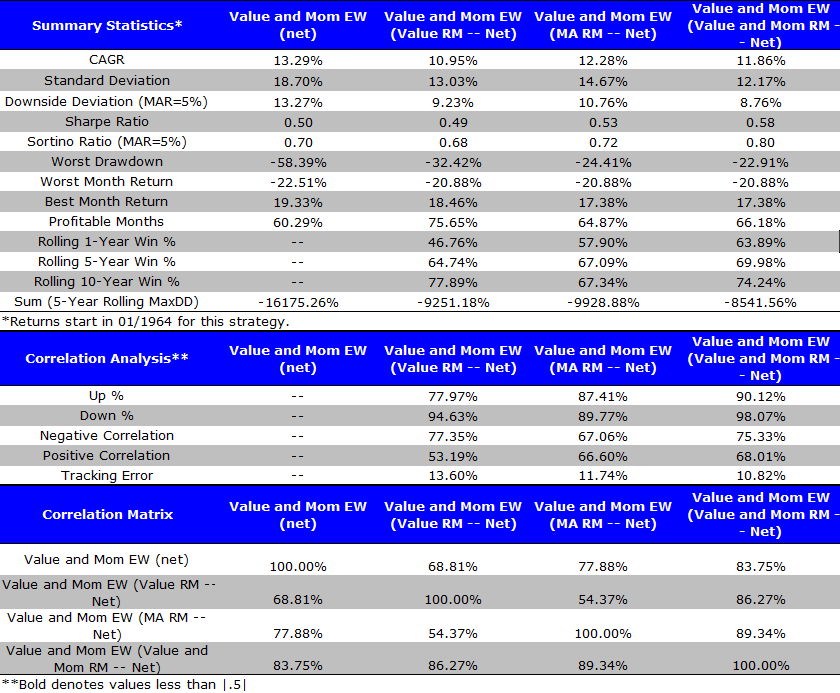
Results (1/1/1964-12/31/2014):
Here we show the results to 4 portfolios:
- Value and Mom EW (net) = Top 100 Value firms and Top 100 Momentum firms formed monthly and held for 3 months. Portfolio is equal-weighted. Returns are net of a 1.00% annual management fee and 2.00% annual transaction costs.
- Value and Mom EW (Value RM — net) = Top 100 Value firms and Top 100 Momentum firms formed monthly and held for 3 months. Portfolio is equal-weighted. Valuation-based market timing rule applied: Own Stocks (Value and Momentum portfolio) when valuations aren’t extreme, otherwise hold risk-free. Returns are net of a 1.00% annual management fee and 2.00% annual transaction costs.
- Value and Mom EW (MA RM — net) = Top 100 Value firms and Top 100 Momentum firms formed monthly and held for 3 months. Portfolio is equal-weighted. Momentum-based market timing rule applied: Own Stocks (Value and Momentum portfolio) if they are above the 12-month MA, own risk-free if below the 12-month MA. Returns are net of a 1.00% annual management fee and 2.00% annual transaction costs.
- Value and Mom EW (Value and Mom RM — net) = Top 100 Value firms and Top 100 Momentum firms formed monthly and held for 3 months. Portfolio is equal-weighted. Valuation and Momentum-based market timing rules are applied, each having a 50% signal weight. Returns are net of a 1.00% annual management fee and 2.00% annual transaction costs.
The results are hypothetical results and are NOT an indicator of future results and do NOT represent returns that any investor actually attained. Indexes are unmanaged, do not reflect management or trading fees, and one cannot invest directly in an index. Additional information regarding the construction of these results is available upon request.
Takeaways:
- Both the Valuation and Momentum-based market timing rules decreased drawdowns (maximum drawdown and sum of drawdowns).
- Combining the Value and Momentum market-timing rules yields the lowest drawdown, as well as the highest Sharpe and Sortino ratios.
Conclusion:
Combining Value and Momentum appears to work for both stock selection and market-timing. One can argue that there are “better” ways to combine Value and Momentum. However, a simple approach (documented above) seems to work, at least historically.
There are few caveats that come to mind:
- The results above are hypothetical and the future could change.
- Valuation-based timing is tough (see introduction of that post) and we’ve cherry picked a system that happens to work in-sample, whereas others we’ve tried don’t seem to work that well.
- These systems can drift violently from standard benchmarks (i.e., one needs to be prepared for tracking error)
- Value and momentum stocks are much more volatile than a passive index and require a disciplined sustainable investor.
Let us know your thoughts!

About the Author: Jack Vogel, PhD
—
Important Disclosures
For informational and educational purposes only and should not be construed as specific investment, accounting, legal, or tax advice. Certain information is deemed to be reliable, but its accuracy and completeness cannot be guaranteed. Third party information may become outdated or otherwise superseded without notice. Neither the Securities and Exchange Commission (SEC) nor any other federal or state agency has approved, determined the accuracy, or confirmed the adequacy of this article.
The views and opinions expressed herein are those of the author and do not necessarily reflect the views of Alpha Architect, its affiliates or its employees. Our full disclosures are available here. Definitions of common statistics used in our analysis are available here (towards the bottom).
Join thousands of other readers and subscribe to our blog.