This study was inspired by Ben Carlson’s blog post a few months ago. Ben highlights Robert Hagstrom’s book “The Warren Buffett Portfolio.”
The high level question is the following: How can one beat the market?
Answer: To beat the market, you have to be different than the market. One simple way to do this is to hold a small number of stocks.
But is this naive approach a good bet?
Experiment Setup
Each month, we select the largest 1,000 U.S. stocks to form our universe. We then randomly form portfolios as follows:
- Portfolio with 15 stocks.
- Portfolio with 50 stocks.
- Portfolio with 100 stocks.
- Portfolio with 300 stocks.
- Portfolio with 500 stocks.
Every month, we create 3,000 portfolios for each of the 5 perturbations listed above. The idea is to randomly select either 15, 50, 100, 300 or 500 stocks from the universe of 1,000 stocks. However, in order to simulate a large number of possibilities, we create 3,000 portfolios (for all 5 selections above) every month!
So on 12/31/1978, we create:
- 3,000 portfolios of 15 stocks
- 3,000 portfolios of 50 stocks
- 3,000 portfolios of 100 stocks
- 3,000 portfolios of 300 stocks
- 3,000 portfolios of 500 stocks
The portfolio returns are equal-weighted. We repeat this process every month. So in total, we have 3,000 draws of the 5 portfolios across time.
Results to the 3,000 draws of the 5 portfolios are shown below:
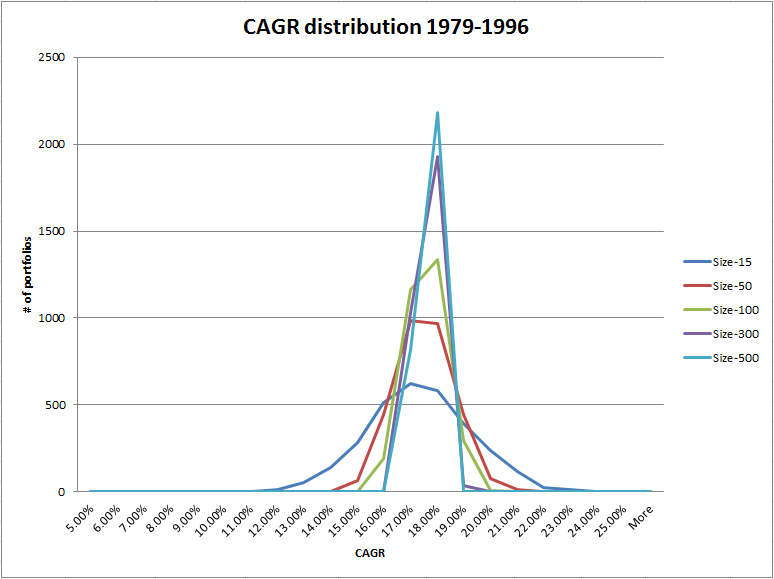
Simulation results (1/1/1979 – 12/31/1996)
CAGR by Size of Portfolio
The results are hypothetical results and are NOT an indicator of future results and do NOT represent returns that any investor actually attained. Indexes are unmanaged, do not reflect management or trading fees, and one cannot invest directly in an index. Additional information regarding the construction of these results is available upon request.
- Takeaway: Notice that the smaller the portfolio size, the more variance in the portfolio returns (fat tails); the larger the portfolio size, there is less variance in the portfolio returns. Here are the baseline statistics:
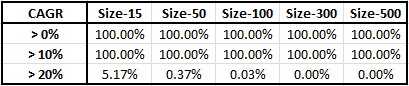
CAGR buckets by Size of Portfolio
The results are hypothetical results and are NOT an indicator of future results and do NOT represent returns that any investor actually attained. Indexes are unmanaged, do not reflect management or trading fees, and one cannot invest directly in an index. Additional information regarding the construction of these results is available upon request.
- Takeaway: The larger the portfolio, the smaller the chance of high performance.
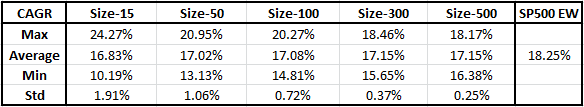
Summary Statistics
The results are hypothetical results and are NOT an indicator of future results and do NOT represent returns that any investor actually attained. Indexes are unmanaged, do not reflect management or trading fees, and one cannot invest directly in an index. Additional information regarding the construction of these results is available upon request.
- Takeaway: Smaller portfolios have higher highs (max) and lower lows (min), as well as a higher standard deviation.
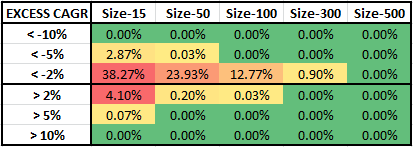
Percentage of Time the Portfolio Beats S&P 500 EW Portfolio
The results are hypothetical results and are NOT an indicator of future results and do NOT represent returns that any investor actually attained. Indexes are unmanaged, do not reflect management or trading fees, and one cannot invest directly in an index. Additional information regarding the construction of these results is available upon request.
- Takeaway: Smaller portfolios (15, 50 and 100 stocks) can sometimes beat the market (S&P 500 EW). However, the small portfolios lose more often than they win!
Let’s examine the results over the second time period.
Simulation results (1/1/1997 – 12/31/2014)
CAGR by Size of Portfolio
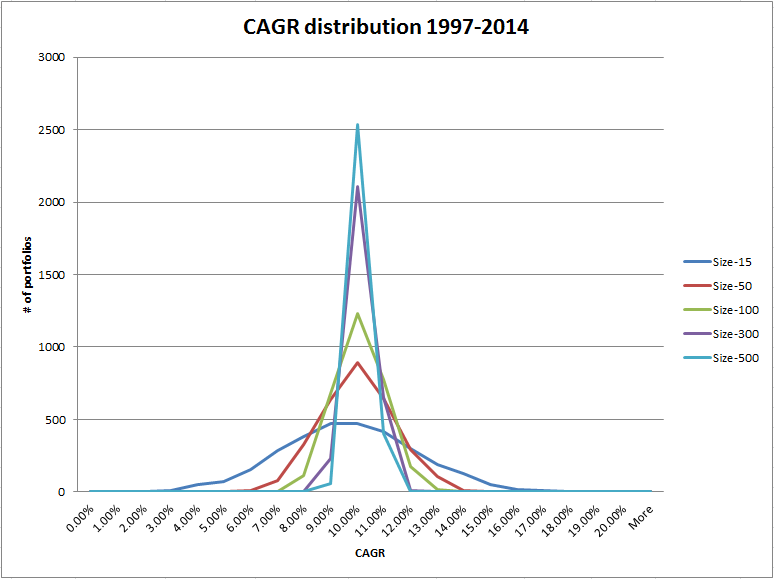
The results are hypothetical results and are NOT an indicator of future results and do NOT represent returns that any investor actually attained. Indexes are unmanaged, do not reflect management or trading fees, and one cannot invest directly in an index. Additional information regarding the construction of these results is available upon request.
- Takeaway: Similar to the first half of the sample — the smaller the portfolio size, the more variance in the portfolio returns (fat tails); the larger the portfolio size, there is less variance in the portfolio returns. Here are the baseline statistics:
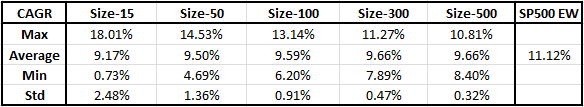
The results are hypothetical results and are NOT an indicator of future results and do NOT represent returns that any investor actually attained. Indexes are unmanaged, do not reflect management or trading fees, and one cannot invest directly in an index. Additional information regarding the construction of these results is available upon request.
- Takeaway: Smaller portfolios have higher highs (max) and lower lows (min), as well as a higher standard deviation (same as our prior analysis).
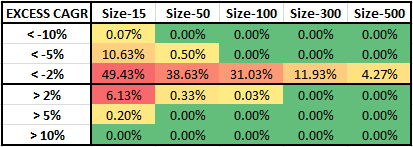
CAGR buckets by Size of Portfolio
The results are hypothetical results and are NOT an indicator of future results and do NOT represent returns that any investor actually attained. Indexes are unmanaged, do not reflect management or trading fees, and one cannot invest directly in an index. Additional information regarding the construction of these results is available upon request.
- Takeaway: The larger the portfolio, the smaller the chance of high performance (again).
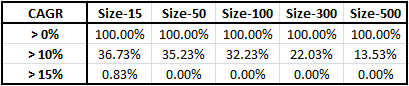
Percentage of Time the Portfolio Beats S&P 500 EW Portfolio
The results are hypothetical results and are NOT an indicator of future results and do NOT represent returns that any investor actually attained. Indexes are unmanaged, do not reflect management or trading fees, and one cannot invest directly in an index. Additional information regarding the construction of these results is available upon request.
- Takeaway: Smaller portfolios (15, 50 and 100 stocks) can sometimes beat the market (S&P 500 EW). However, the small portfolios still lose more often than they win!
Conclusion
The results above show that while selecting smaller portfolios of stocks, one can beat the market more often than with a larger portfolio. However, if randomly selecting a smaller portfolio of stocks, the investor will lose more often than they win!
Is all hope lost?
We also believe that in an effort to beat the market, you have to be different (concentrated portfolios), but also use security selection.
We prefer 2 anomalies (Value and Momentum):
If trying to beat the market, leverage the security selection models to form your smaller portfolios!

About the Author: Wesley Gray, PhD
—
Important Disclosures
For informational and educational purposes only and should not be construed as specific investment, accounting, legal, or tax advice. Certain information is deemed to be reliable, but its accuracy and completeness cannot be guaranteed. Third party information may become outdated or otherwise superseded without notice. Neither the Securities and Exchange Commission (SEC) nor any other federal or state agency has approved, determined the accuracy, or confirmed the adequacy of this article.
The views and opinions expressed herein are those of the author and do not necessarily reflect the views of Alpha Architect, its affiliates or its employees. Our full disclosures are available here. Definitions of common statistics used in our analysis are available here (towards the bottom).
Join thousands of other readers and subscribe to our blog.