We recently examined a handful of metrics related to S&P 500 valuations.
- P/E
- P/B
- TEV/EBITDA
- TEV/FCF
- TEV/GP
Details on these metrics can be found here.
Let’s look at the high level summary as of February 28, 2015 from 1/1990 to 2/2015:
| PE_RATIO | PB_RATIO | TEV/EBITDA | TEV/FCF | TEV/GP | |
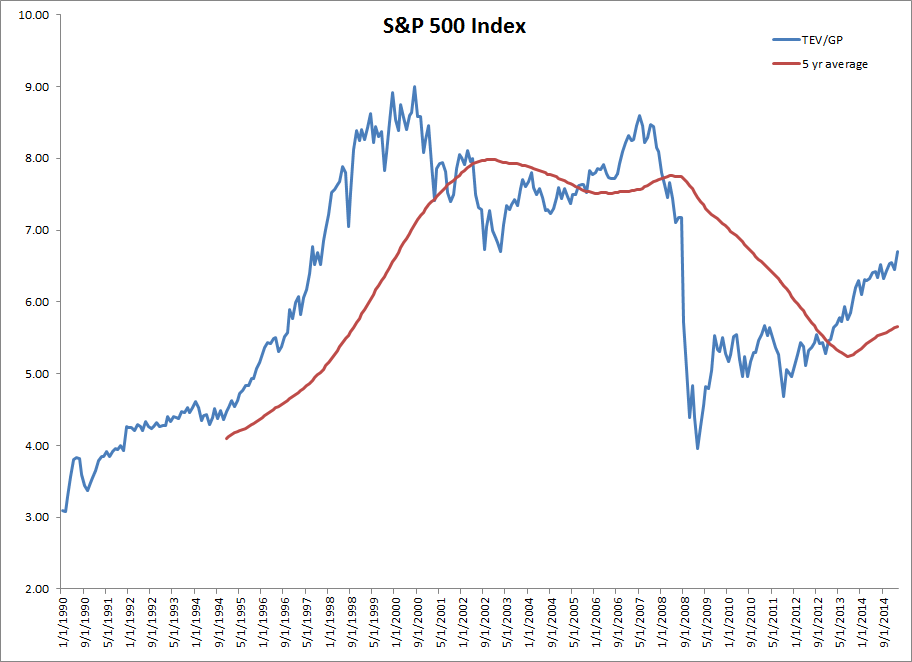
| Current | 18.49 | 2.85 | 11.57 | 23.08 | 6.57 |
| Current Percentile | 54% | 65% | 73% | 25% | 56% |
| Min | 11.89 | 1.64 | 6.36 | 13.52 | 3.09 |
| 5% | 13.88 | 1.94 | 7.40 | 15.36 | 3.85 |
| 25% | 16.39 | 2.27 | 8.91 | 23.22 | 4.84 |
| 50% | 18.09 | 2.69 | 10.38 | 34.07 | 6.14 |
| 75% | 22.65 | 3.05 | 11.75 | 46.62 | 7.63 |
| 95% | 27.82 | 4.67 | 13.49 | 61.14 | 8.45 |
| Max | 29.92 | 5.00 | 14.51 | 145.10 | 9.00 |
The metrics aren’t screaming “overvalued:” P/E, P/B, TEV/EBITDA, and TEV/GP are all in the 50-75 percentile; TEV/FCF is actually in the 2 to 25 percentile.
In fact, adjusted for the current interest rate environment (much lower than it was in the past), the argument that the market is extremely overvalued is arguably far-fetched.
Visual Valuations:
P/E
Price-to-Earnings
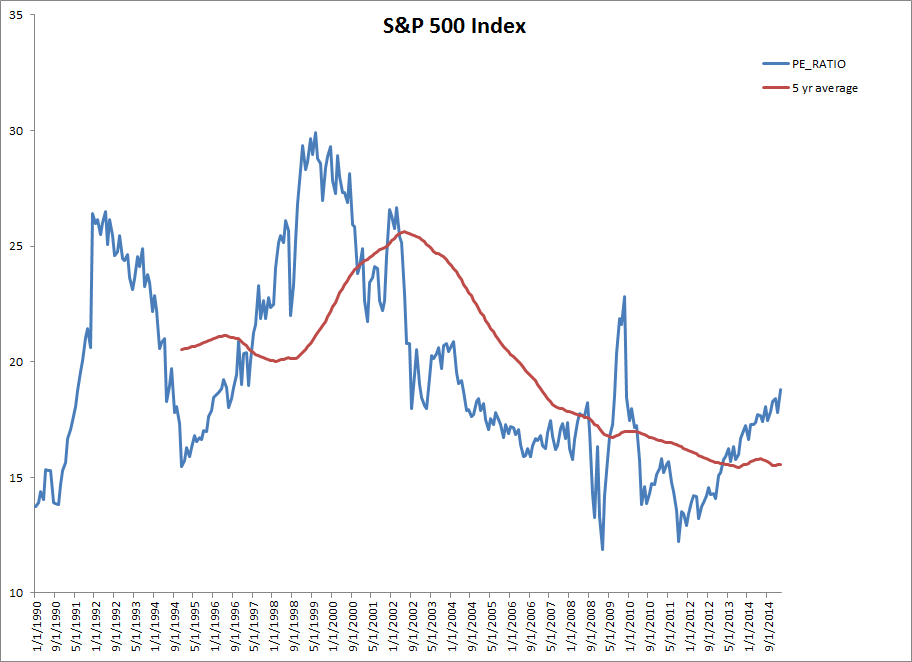
The results are hypothetical results and are NOT an indicator of future results and do NOT represent returns that any investor actually attained. Indexes are unmanaged, do not reflect management or trading fees, and one cannot invest directly in an index. Additional information regarding the construction of these results is available upon request.
P/B
Price-to-Book
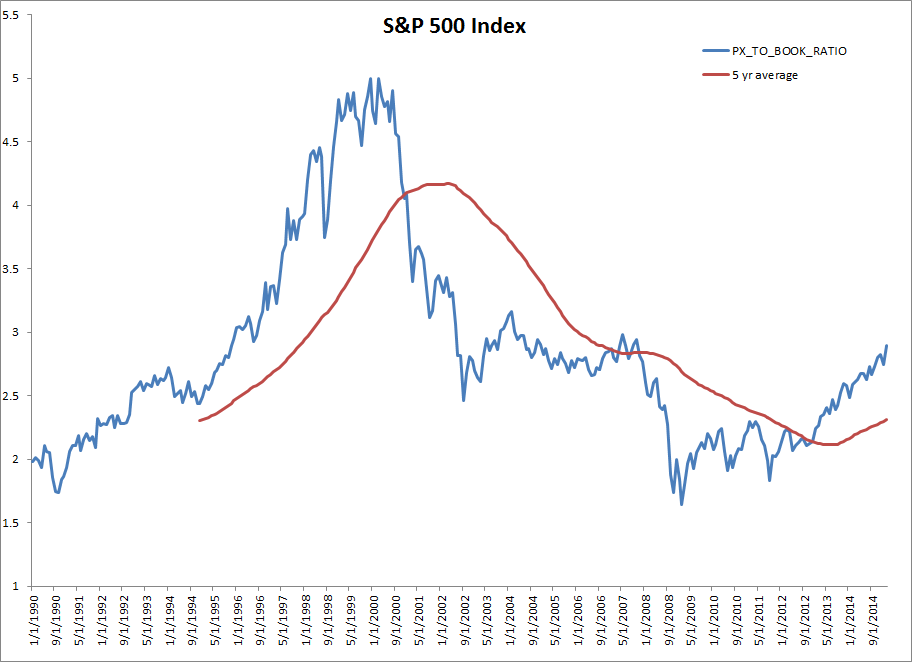
The results are hypothetical results and are NOT an indicator of future results and do NOT represent returns that any investor actually attained. Indexes are unmanaged, do not reflect management or trading fees, and one cannot invest directly in an index. Additional information regarding the construction of these results is available upon request.
TEV/EBITDA
Total Enterprise Value-to-Earnings Before Interest Taxes Depreciation and Amortization
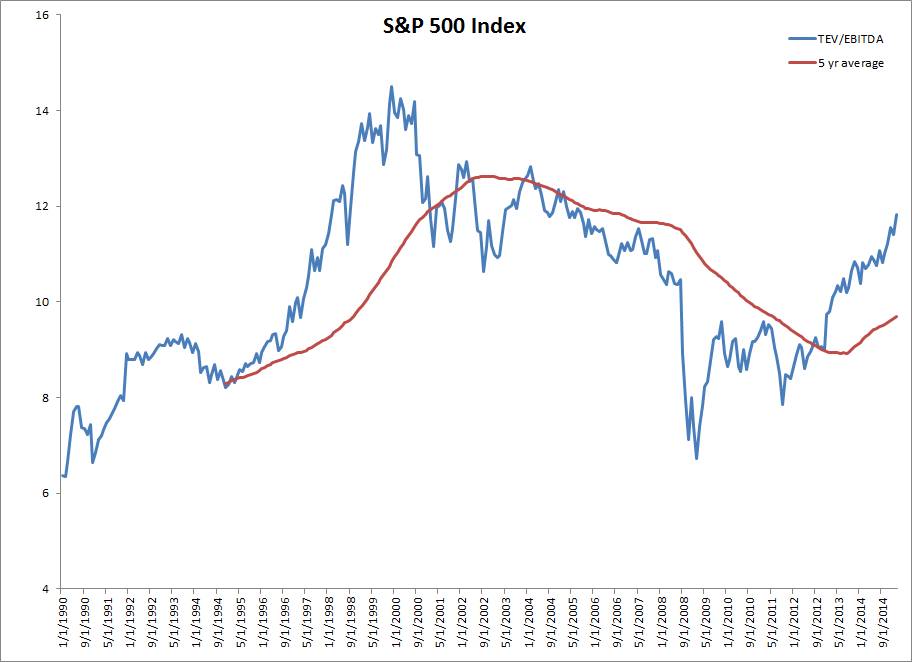
The results are hypothetical results and are NOT an indicator of future results and do NOT represent returns that any investor actually attained. Indexes are unmanaged, do not reflect management or trading fees, and one cannot invest directly in an index. Additional information regarding the construction of these results is available upon request.
TEV/FCF
Total Enterprise Value-to-Free Cash Flow
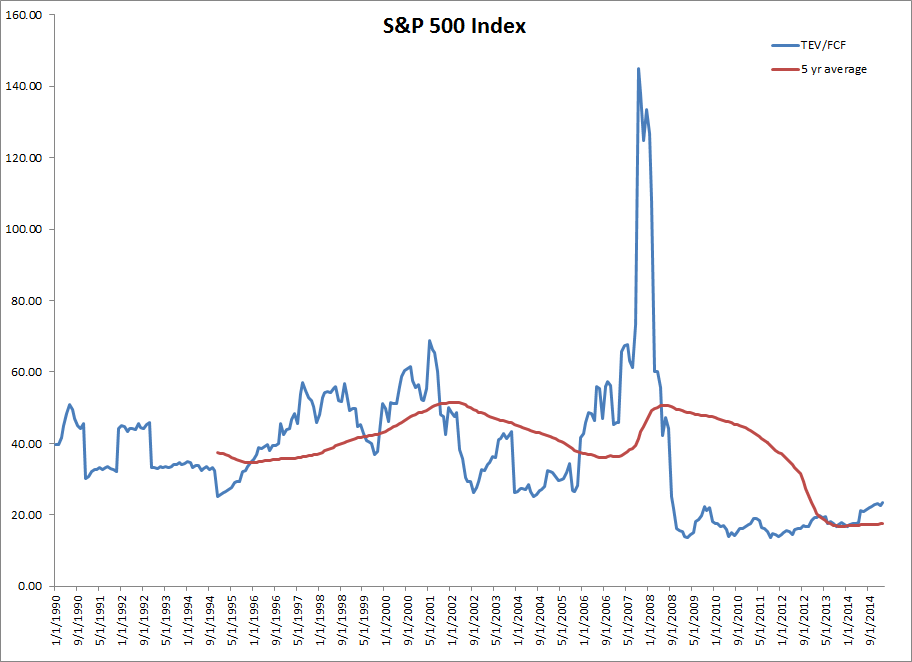
The results are hypothetical results and are NOT an indicator of future results and do NOT represent returns that any investor actually attained. Indexes are unmanaged, do not reflect management or trading fees, and one cannot invest directly in an index. Additional information regarding the construction of these results is available upon request.
TEV/GP
Total Enterprise Value-to-Gross Profits
The results are hypothetical results and are NOT an indicator of future results and do NOT represent returns that any investor actually attained. Indexes are unmanaged, do not reflect management or trading fees, and one cannot invest directly in an index. Additional information regarding the construction of these results is available upon request.
Additional Thoughts
Our quick and dirty analysis suggests that the market isn’t extremely overvalued.
But this doesn’t seem to jibe with many reports coming out in the media. Why?
The answer has to do with a framing effect. Many “markets-are-crazy-expensive” stories look at the history of markets going back to <1900 (typically using the Shiller CAPE data). We just did our own version of this story a few weeks ago. Sure enough, based on CAPE ratios, the market is in the 94th percentile–pretty high!
Nonetheless, the data for our metrics only go back to 1990–not 1890!
When current valuations are positioned against valuations over the past 25 years, things look “normal-ish.” Yet, when current valuations are positioned against valuations from pre-1990, they may appear “insane.”
Not sure what to make of this “framing” effect. On one hand, a longer history may give us more insight into valuations over time, on the other hand, market conditions 100+ years ago may be different than they are today.
How useful is it to compare valuations today, versus valuations that prevailed at other points in history? The dynamics associated with longer run regimes may be in place. For example, in the beginning of the 20th century, the U.S. market was a comparatively young emerging market economy, and it wasn’t obvious that it would emerge as the dominant economy for the next 100 years. In these early days, the U.S. market may have been priced more cheaply based on its embedded emerging market risk. For a more modern example, consider valuations on the BRIC and the PIGS versus the developed market countries? Emerging market countries often have more risk, so on average, their valuation metrics are much lower than those of developed market countries.
Also, 25 years is a decent length of time. Maybe this sample from the recent past better represents current conditions and risks associated with investing in U.S. markets today, versus the alternatives.
Again, when you are computing average valuations, if you include long stretches when U.S. markets were cheap for reasons unrelated to important aspects of modern world economies, you may get an average that is flawed in some ways. Then again, this sounds a bit like the “new valuation paradigm” thinking that prevailed during the dotcom boom when valuations went crazy.
Regardless, our analysis above will hopefully enhance the discussion around market valuations. The current discussion is very black and white–commentators are calling for an epic and inevitable crash, or they are calling for Dow 100,000. Hopefully, we open the debate and generate more nuanced views on market valuations. A good example of this type of sophisticated thinking is presented at http://www.philosophicaleconomics.com/. If you know others, please share.

About the Author: Wesley Gray, PhD
—
Important Disclosures
For informational and educational purposes only and should not be construed as specific investment, accounting, legal, or tax advice. Certain information is deemed to be reliable, but its accuracy and completeness cannot be guaranteed. Third party information may become outdated or otherwise superseded without notice. Neither the Securities and Exchange Commission (SEC) nor any other federal or state agency has approved, determined the accuracy, or confirmed the adequacy of this article.
The views and opinions expressed herein are those of the author and do not necessarily reflect the views of Alpha Architect, its affiliates or its employees. Our full disclosures are available here. Definitions of common statistics used in our analysis are available here (towards the bottom).
Join thousands of other readers and subscribe to our blog.