Short Interest and Aggregate Market Returns
- Rapach, Ringgenberg and Zhou
- A version of the paper can be found here.
- Want a summary of academic papers with alpha? Check out our Academic Research Recap Category.
Abstract:
We show that aggregate short interest is one of the strongest known predictors of the equity risk premium. High aggregate short interest predicts lower future equity returns at monthly, quarterly, semi-annual, and annual horizons. In addition, aggregate short interest outperforms a host of popular predictors from the extant literature both in sample and out of sample. We investigate the source of this predictability and find that high aggregate short interest anticipates negative future industrial production growth, aggregate earnings growth, and cash flow innovations. Overall, our results are consistent with theoretical models of informed trading by short sellers. In other words, our results suggest that short sellers are informed traders who are able to anticipate changes in macroeconomic conditions and associated changes in equity market returns.
Alpha Highlight:
Goyal and Welch (2008) take a comprehensive look at various popular market predictor variables from the existing literature, including such favorites as dividend-price ratios (yield), dividend-earnings ratios (payout ratios), book-to-market ratio, volatility and others. In reviewing the evidence, both in-sample and out-of-sample, Goyal and Welch conclude that none of these variables seems to robust.
Yet hope springs eternal in the market-timing literature.
This paper argues that there is a powerful market indicator, which performs better than 14 popular predictor variables considered in Goyal and Welch (2008). This market premium indicator is aggregate “Short Interest”:
- Short interest (defined by investopedia): The total number of shares of a particular stock that have been sold short by investors but have not been covered or closed out. This can be expressed as a number or as a percentage… When expressed as a percentage, short interest is the number of shorted shares divided by the number of shares outstanding.
This paper indicates that increases in aggregate short interest are associated with lower future market returns as well as declines in future economic activity.
Short Interest Index (SII):
To test short interest’s ability to predict the market, the authors take samples of monthly firm-level aggregate short interest data from 1973 to 2012 from Compustat. The paper generates a variable called, “Short Interest Index (SII)” to measure overall market pessimism.
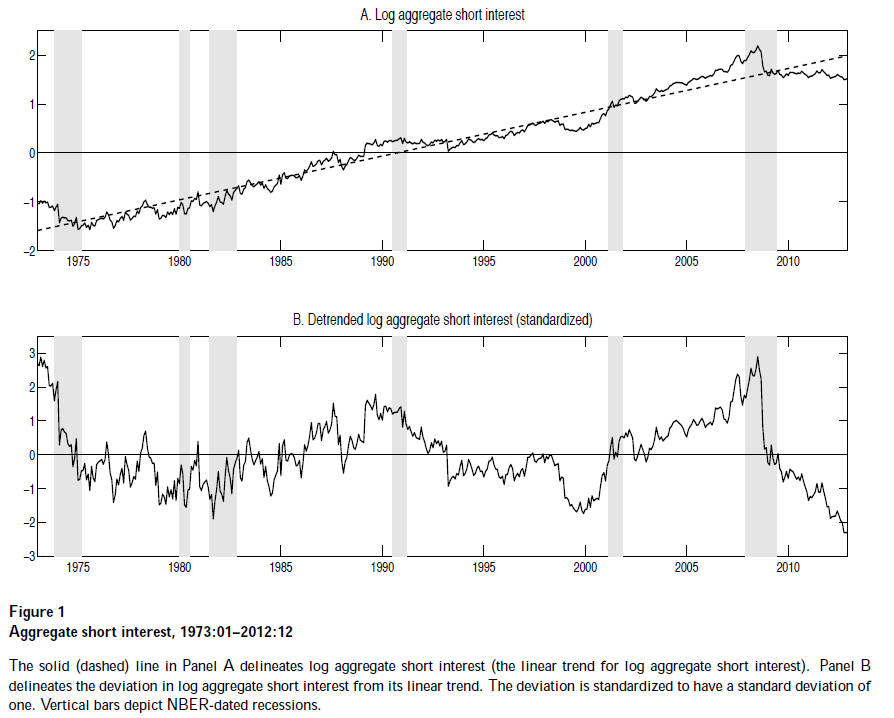
- Short Interest Index (SII): First, the authors detrend the raw aggregate short interest series to exclude this secular change factor; Then, the authors standardize this detrended series. Thus, SII variable is the standardized, detrended log aggregate short interest.
The results are hypothetical results and are NOT an indicator of future results and do NOT represent returns that any investor actually attained. Indexes are unmanaged, do not reflect management or trading fees, and one cannot invest directly in an index. Additional information regarding the construction of these results is available upon request.
Panel A shows the raw log aggregate short interest, which has an upward trend; and panel B shows the detrended series, which appears fairly stable over time. Notice in particular that the SII increases substantially in the middle of 2008, just before the worst part of the financial crisis, and falls sharply during the later stages of the crisis. This provides a hint that there is potentially some correlation between short interest and market performance.
The results show that while the 14 market predictors exhibit strong correlations with each other, SII is largely unrelated to previous predictive variables! That is, the SII variable seems to contain information that is substantially different from other popular market predictors.
To compare the predictive powers of these indicators, the authors run regressions on SII and the 14 predictors in Goyal and Welch. The other 14 popular predictors are listed below:
- Log dividend-price ratio (DP): difference between the log of dividends and the log of prices.
- Log dividend yield (DY): difference between the log of dividends and the log of lagged prices.
- Log earnings-price ratio (EP): difference between the log of earnings and the log of prices.
- Log dividend-payout ratio (DE): difference between the log of dividends and the log of earnings.
- Excess stock return volatility (RVOL): computed using a 12-month moving standard deviation estimator.
- Book-to-market ratio (BM): the ratio of book value to market value for DJIA.
- Net equity expansion (NTIS): the ratio of 12-month moving sums of net issues by NYSE listed stocks divided by the total end-0f-year market capitalization of NYSE stocks.
- Treasury bill rate (TBL): interest rate on a 3-month treasury bill.
- Long-term yield (LTY): yield on long-term US government bonds.
- Long-term return (LTR): return on long-term US government bonds.
- Term Spread (TMS): difference between the long term yield on government bonds and treasury bills.
- Default yield spread (DFY): difference between BAA and AAA-rated corporate bond yields.
- Default return spread (DFR): difference between long-term corporate bond and long-term government bond returns.
- Inflation (INFL): calculated from the CPI for all urban consumers.
Key Findings:
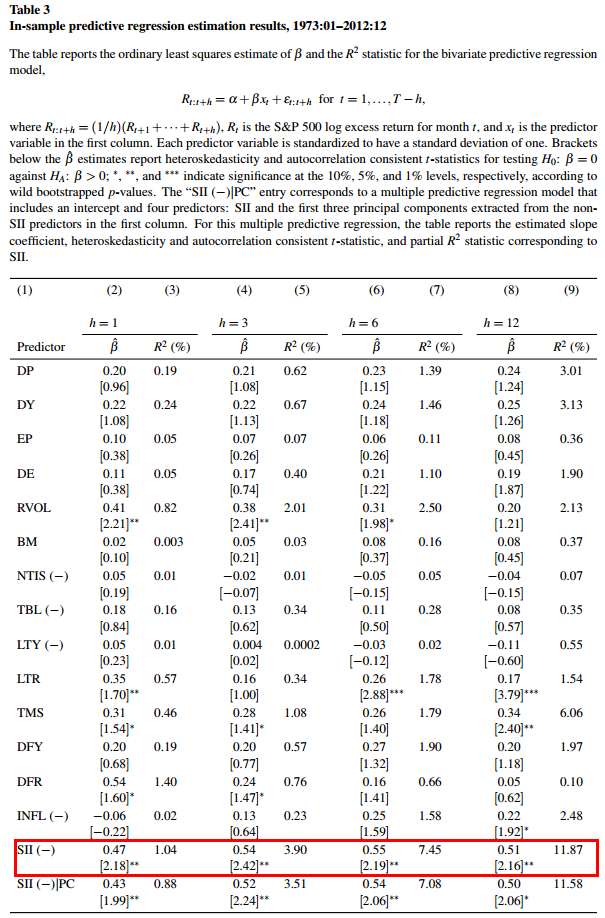
In-sample test: results show that increases in the SII strongly predict lower future S&P 500 premiums.
- A one-standard-deviation increase in the SII corresponds to an 47 basis point decrease in future monthly premiums.
- Predictive power is significant: R-square of SII regression is over 1% at the monthly predict horizon and is almost 12% at the annual predict horizon. (Thompson 2008 and Zhou 2010 argue that a monthly R-square statistic of approximately 0.5% represents economic significance)
- Among the remaining 14 predictors, only RVOL, TMS, and DFR show t-stat significance.
The results are hypothetical results and are NOT an indicator of future results and do NOT represent returns that any investor actually attained. Indexes are unmanaged, do not reflect management or trading fees, and one cannot invest directly in an index. Additional information regarding the construction of these results is available upon request.
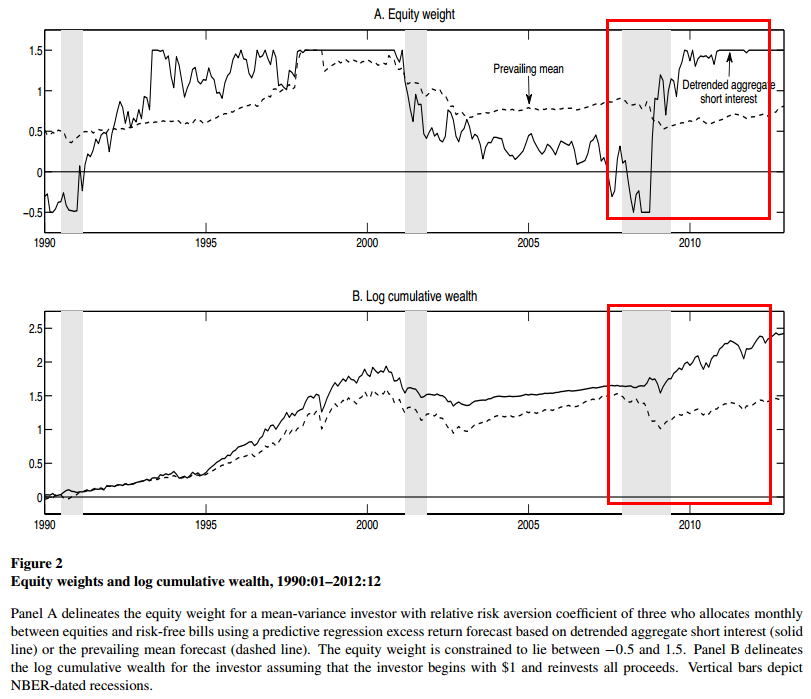
Asset Allocation: Part 4 in this paper measures the economic significance of SII for asset allocation. It considers a mean-variance investor who following the SII predictive strategy to determine equity allocations.
Let’s see an example of how SII prediction works during ’08 financial crisis.
Panel A shows that during the early stage of great recession, the SII portfolio increases its short position. Then it subsequently increases its long position from 2009 to 2012, riding the recovery rally. Panel B illustrates that cumulative wealth grows substantially from the end of 2007 to the end of 2012!
The results are hypothetical results and are NOT an indicator of future results and do NOT represent returns that any investor actually attained. Indexes are unmanaged, do not reflect management or trading fees, and one cannot invest directly in an index. Additional information regarding the construction of these results is available upon request.
SII is associated with macroeconomic conditions.
Paper further points out that a higher SII is associated with lower future industrial production and aggregate real earning growth. Also, a higher SII strongly predicts lower subsequent cash flow shocks. The authors believes that these relationships suggest that short sellers have some ability to forecast future slowdowns in economic activity.
Conclusions:
We have done extensive research around the question of whether short interest can be a useful tool for predicting equity market premiums. Our conclusion is that this measure–like many others–is not robust to small changes. That said, the indicator is interesting and worth a look for financial economists.

About the Author: Wesley Gray, PhD
—
Important Disclosures
For informational and educational purposes only and should not be construed as specific investment, accounting, legal, or tax advice. Certain information is deemed to be reliable, but its accuracy and completeness cannot be guaranteed. Third party information may become outdated or otherwise superseded without notice. Neither the Securities and Exchange Commission (SEC) nor any other federal or state agency has approved, determined the accuracy, or confirmed the adequacy of this article.
The views and opinions expressed herein are those of the author and do not necessarily reflect the views of Alpha Architect, its affiliates or its employees. Our full disclosures are available here. Definitions of common statistics used in our analysis are available here (towards the bottom).
Join thousands of other readers and subscribe to our blog.