A Tug of War: Overnight Versus Intraday Expected Returns
- Lou, Polk and Skouras
- A version of the paper can be found here.
- Want a summary of academic papers with alpha? Check out our Academic Research Recap Category.
Abstract:
We decompose the abnormal profi ts associated with well-known patterns in the cross-section of expected returns into their overnight and intraday components. We show that, on average, all of the abnormal returns on momentum strategies remarkably occur overnight while the abnormal profi ts on the other trading strategies we consider primarily occur intraday. These patterns are extremely robust across subsamples and indeed are stronger for large-cap and high-price stocks. We argue that investor heterogeneity may explain why momentum pro fits tend to accrue overnight. We first provide evidence that, relative to individuals, institutions prefer to trade during the day and against the momentum characteristic. We then highlight conditional patterns that reveal a striking tug of war. Either in the time series, when the amount of momentum activity is particularly low, or in the cross-section, when the typical institution holding a stock has a particularly strong need to rebalance, we find that momentum returns are even larger overnight and more strongly reverse during the day. Both cases generate variation in the spread between overnight and intraday returns on the order of two percent per month.
Alpha Highlight:
Months ago we highlighted a paper on intraday momentum, which states that the first half-hour return predicts the last half-hour returns. We find no evidence to support this result from our in-house backtests.
This paper, taking the opposite view, points out that 100% of the momentum premiums remarkably occur overnight, rather than intraday.
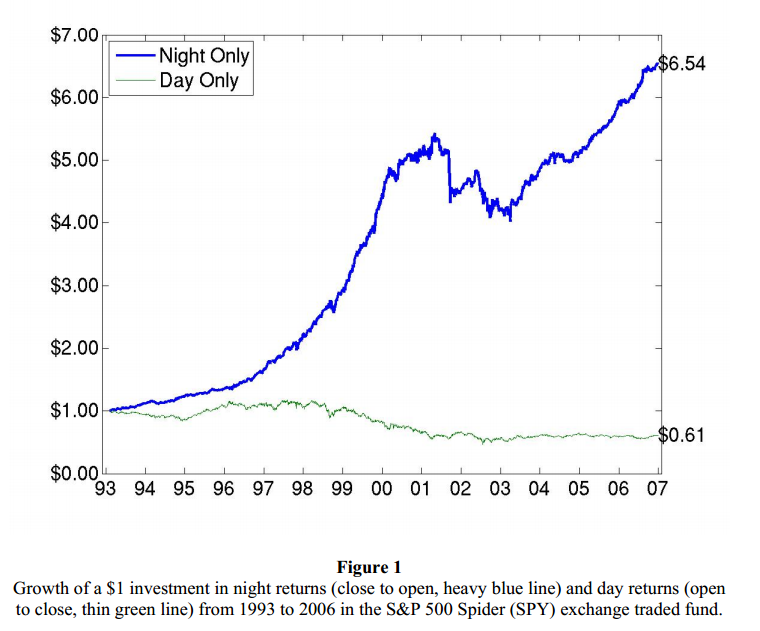
We must be careful in interpreting this papers results because Cooper, Cliff, and Gulen show that ALL returns associated with stocks are from holding overnight risk. This is shown in the figure below (from Cooper, Cliff and Gulen):
The results are hypothetical results and are NOT an indicator of future results and do NOT represent returns that any investor actually attained. Indexes are unmanaged, do not reflect management or trading fees, and one cannot invest directly in an index. Additional information regarding the construction of these results is available upon request.
To test whether momentum premiums occur intraday or overnight, this paper decomposes the close-to-close return into 2 components: intraday return and overnight return. In other words, overnight return plus intraday return will equal the close-to-close return. The paper calculates the components of close-to-close return using the methodology below:
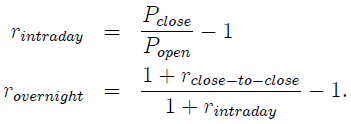
intraday return vs. overnight return
The paper examines the holding-period returns of a momentum strategy (MOM). Following the method set forth in Jegadeesh and Titman (1993), the paper measures momentum over a 12-month ranking period and then eliminates the prior month before forming portfolios. In addition to momentum, several other strategies are tested in the remainder of the paper: size, value, earnings momentum, industry momentum, profitability, investment, idiosyncratic volatility, beta, turnover, equity issuance, discretionary accruals, and short-term reversals.
Key Findings:
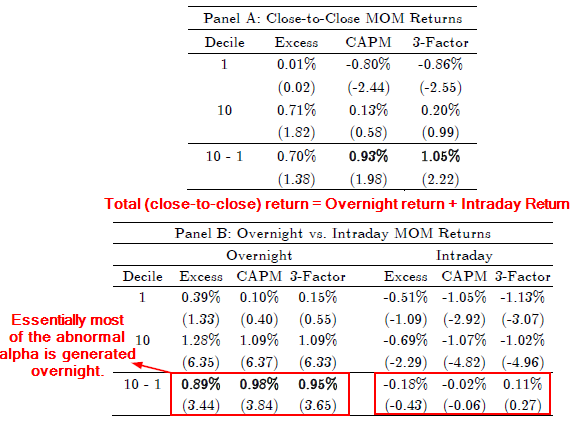
Panel A lists the close-to-close returns of the momentum strategy. As discussed above, close-to-close return equals the sum of the overnight return and the intraday return. Momentum seems to show up in close-to-close returns. Panel B shows the main result of this paper: Almost ALL of the abnormal returns in the momentum strategy are generated overnight, rather than intraday. Specifically, the overnight 3-factor alpha is a significant 0.95%, while the intraday 3-factor alpha is an insignificant 0.11%.
The results are hypothetical results and are NOT an indicator of future results and do NOT represent returns that any investor actually attained. Indexes are unmanaged, do not reflect management or trading fees, and one cannot invest directly in an index. Additional information regarding the construction of these results is available upon request.
In contrast, the premiums on Size and Value strategies (and many other strategies listed above) occur entirely intraday (Table IV in this paper).
Potential Explanations:
So what are the possible explanations of overnight momentum premiums? The paper provides three possible explanations:
- Traditional models of risk? —- No: Table II shows the Fama and French’s three-factors does not do a good job of accounting for the overnight momentum premiums.
- Behavioral explanations? —- No: From a behavioral perspective, investors’ underreaction to news is a potential contributor to MOM premiums. As we know, some news is released before or after markets close, including earnings announcements. So the paper examines whether news releases may explain overnight MOM. –> Results: Table IV shows no statistical evidence to support this hypothesis.
- Investor heterogeneity? —- Yes: The paper argues that investor heterogeneity may help explain the overnight momentum premiums. Specifically, the paper tests the degree of institutional activity overnight and intraday. Two questions are when institutional investors tend to trade and what types of stocks they trade.
- WHEN do institutions trade: The paper hypothesizes that institutional investors tend to trade intraday, and do their trading near the market close. However, individuals are more likely to evaluate their portfolios after work and thus they tend to execute trades when markets open. –> Results: institutions tend to trade intraday while individuals are more likely to trade overnight.
- WHAT types of stocks do institutions trade. –> Results: Table VI illustrates that institutions prefer to trade against the momentum characteristic during the day.
In sum, virtually all of the abnormal returns associated with momentum strategies occur overnight, and one reason for this appears to be investor heterogeneity, as institutions trade more heavily at the close and against momentum during the day, while individuals trade at the open, and presumably trade momentum stocks.

About the Author: Wesley Gray, PhD
—
Important Disclosures
For informational and educational purposes only and should not be construed as specific investment, accounting, legal, or tax advice. Certain information is deemed to be reliable, but its accuracy and completeness cannot be guaranteed. Third party information may become outdated or otherwise superseded without notice. Neither the Securities and Exchange Commission (SEC) nor any other federal or state agency has approved, determined the accuracy, or confirmed the adequacy of this article.
The views and opinions expressed herein are those of the author and do not necessarily reflect the views of Alpha Architect, its affiliates or its employees. Our full disclosures are available here. Definitions of common statistics used in our analysis are available here (towards the bottom).
Join thousands of other readers and subscribe to our blog.