Strategies employing risk parity have been favored by mutual funds and other market participants the past few years. The attraction of risk parity strategies are two-fold: 1) the great story associated with the approach and 2) the favorable historical performance over the past 30 years. However, there is an argument that historical risk parity performance has been driven by leveraged exposure to Treasury Bonds, which have been on an epic tear the past ~30 years.
Nonetheless, good stories such as risk parity never die on Wall Street, they merely adapt and overcome. This white paper by UBS highlights skepticism around risk parity and presents a different, but related asset allocation method: Sharpe Parity.
Risk Parity Background
As you may recall, risk parity identifies weights that equalize “risk” across asset classes. Let’s first review a simple risk parity example.
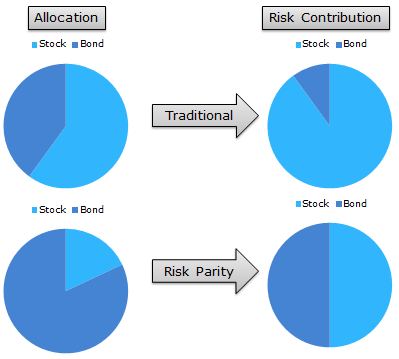
Here is a visual interpretation of how risk parity works. If we allocate to a 60/40 stock/bond portfolio on a dollar-weighted basis, on a risk-contribution basis, we might be getting 90% of our risk from stocks and 10% of our risk from bonds.
Risk parity comes to the so-called rescue.
Risk parity suggests that we rejigger the dollar-weighted 60/40 portfolio in such a way that the risk contributions end up being 50% driven by bond exposure and 50% driven by stock exposure. In other words, our “risk contributions” are at parity, hence the title “risk parity.”
How does this work in practice using the most basic version of risk parity outlined in the Asness, Frazzini, and Pedersen paper:
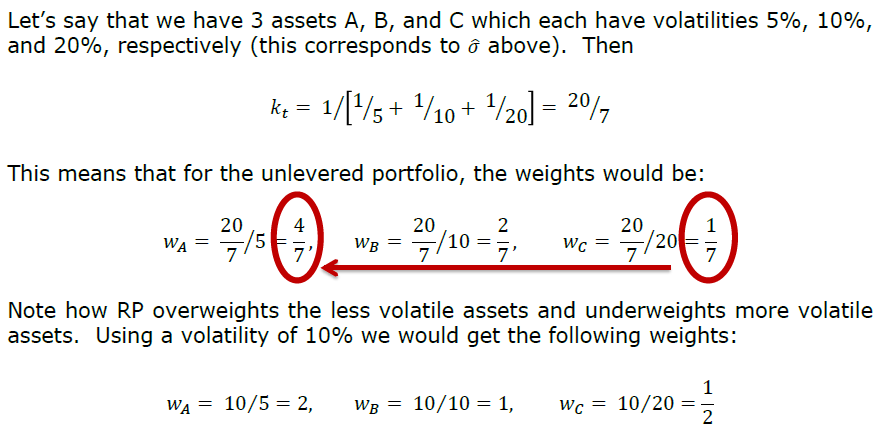
Source: Leverage Aversion and Risk Parity (2012), Financial Analysts Journal, 68(1), 47-59
But UBS Doesn’t like Risk Parity. Why?
As per their own research:
- Risk parity ignores return and focuses only on risk;
- Risk parity uses volatility as the sole measure of risk, while neglecting other credit-related risks, such as default risk and illiquidity;
- Risk parity encounters huge drawdowns if bonds and equity sell off together;
- A low nominal return world makes recovery from risk parity drawdowns difficult.
UBS proposes a new asset allocation strategy, which shares some concepts with risk parity, but in their approach risk parity’s “standard deviation” is replaced with an estimate for an asset’s Sharpe Ratio. Here’s an explanation of the concept:
Think about it this way: if asset X has a Sharpe ratio of 2 it means that we have two units of return for 1 unit of risk, while asset Y with a Sharpe ratio of 1 gives us only 1 unit of return for the same amount of risk. In that case we construct a portfolio with the weight for asset X being double the weight of asset Y.
Strategy Background
This approach makes some sense, as it seems to account for return as well as risk. This approach is also in line with modern portfolio concepts such as mean-variance analysis, where investors want to maximize marginal Sharpe Ratios to create the so-called “tangency portfolio” that all MBA 101 students know and love.
But how does “Sharpe Parity” stand up to empirical scrutiny? In order to address this question, we compare 4 asset allocation approaches: Equal-weight allocation, an equal-weight allocation with a Simple Moving Average rule, simple Risk Parity, and Sharpe Ratio Parity.
- Equal-weight (EW_Index): monthly rebalanced equal-weight portfolios.
- Simple Moving Average (EW_Index_MA): calculate a simple moving average each month (12 month average); if the MA rule is triggered (when the current price > 12 month moving average), buy risk, or else, allocate to the risk-free asset.
- Risk Parity: follow the simple risk parity algorithm; use a look-back period of 36 months for the “standard” risk parity model.
- Sharpe Parity: use a look-back period of 36 months for the Sharpe Parity model; if an asset has a negative Sharpe Ratio, this asset’s weight will be 0; note that if all the assets’ Sharpe Ratios are negative, the strategy will allocate 100% to the risk-free asset.
Data Description
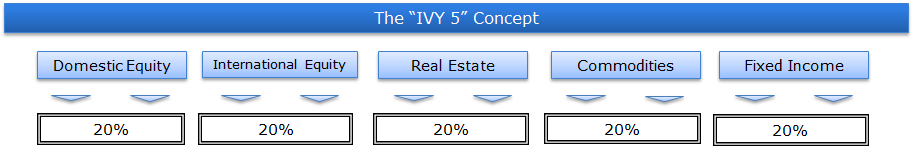
To test these 4 strategies, we apply them to the “IVY 5” asset classes:
- SP500 = SP500 Total Return Index
- EAFE = MSCI EAFE Total Return Index
- REIT = FTSE NAREIT All Equity REITS Total Return Index
- GSCI = GSCI Index
- LTR = Merrill Lynch 7-10 year Government Bond Index
Our simulated historical performance period is from 1/1/1980 to 7/31/2014. Results are gross, and thus do not include the effects of fees. All returns are total returns and include the reinvestment of distributions (e.g., dividends). Data was obtained via Bloomberg. Indexes are unmanaged, do not reflect management or trading fees, and one cannot invest directly in an index. Please see the disclosures at the end of this document for additional information.
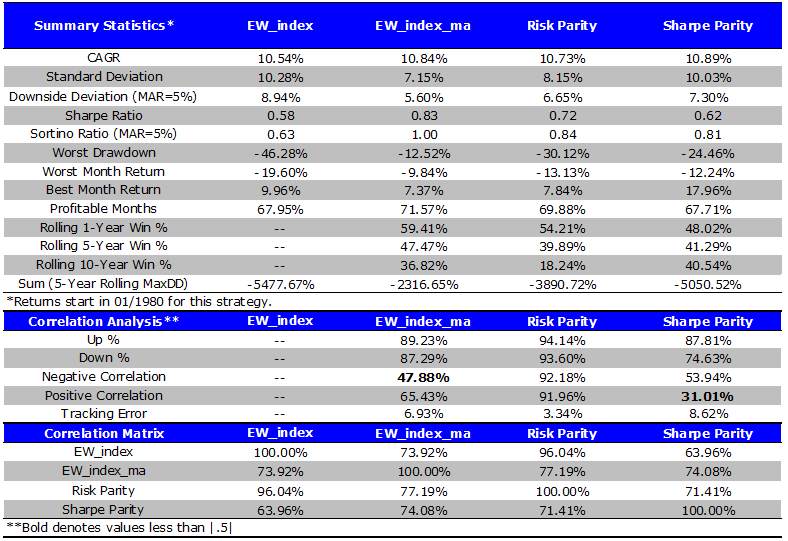
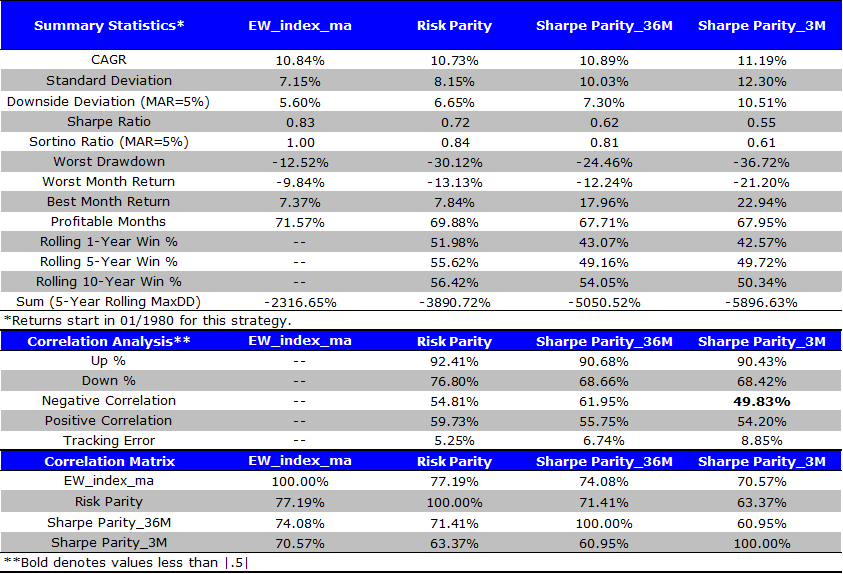
Monthly Rebalance Performance
- Sharpe Parity has a slightly higher CAGR. However on a risk-adjusted basis, Equal Weight MA and Risk Parity outperform the Sharpe Parity system, as reflected in their higher sharpe and sortino ratios.
- The simple moving average technique has the lowest drawdown and the best overall risk-adjusted performance.
The results are hypothetical results and are NOT an indicator of future results and do NOT represent returns that any investor actually attained. Please see disclosures for additional information. Additional information regarding the construction of these results is available upon request.
Does Lookback period matter?
Next, we change the look-back period from 36 months to 3 months, which is identical to the lookback period used in the UBS whitepaper.
Here’s the result:
- Sharpe Parity based on a 3 months lookback period has larger CAGR, but also has larger drawdowns, on a monthly, worst case, and cumulative basis. Sharpe and sortino ratios are worse than the 36 month lookback version.
The results are hypothetical results and are NOT an indicator of future results and do NOT represent returns that any investor actually attained. Please see disclosures for additional information. Additional information regarding the construction of these results is available upon request.
Conclusions
Based on these results, it seems hard to conclude that Sharpe Parity, particularly with a 3 month look-back period, offers a clear-cut advantage over traditional Risk Parity approaches. In fact, on a risk-adjusted basis, it compares poorly. Based on this analysis, it would appear that simple equal-weight portfolios with trend-following rules have worked better than more complicated risk parity or sharpe parity systems.

About the Author: Wesley Gray, PhD
—
Important Disclosures
For informational and educational purposes only and should not be construed as specific investment, accounting, legal, or tax advice. Certain information is deemed to be reliable, but its accuracy and completeness cannot be guaranteed. Third party information may become outdated or otherwise superseded without notice. Neither the Securities and Exchange Commission (SEC) nor any other federal or state agency has approved, determined the accuracy, or confirmed the adequacy of this article.
The views and opinions expressed herein are those of the author and do not necessarily reflect the views of Alpha Architect, its affiliates or its employees. Our full disclosures are available here. Definitions of common statistics used in our analysis are available here (towards the bottom).
Join thousands of other readers and subscribe to our blog.