Does the Stock Market Overreact?
- De Bondt and Thaler
- A version of the paper can be found here.
- Want a summary of academic papers with alpha? Check out our Academic Research Recap Category.
Abstract:
Research in experimental psychology suggests that, in violation of Bayes’ rule, most people tend to “overreact” to unexpected and dramatic news events. This study of market efficiency investigates whether such behavior affects stock prices. The empirical evidence, based on CRSP monthly return data, is consistent with the overreaction hypothesis. Substantial weak form market inefficiencies are discovered. The results also shed new light on the January returns earned by prior “winners” and “losers.” Portfolios of losers experience exceptionally large January returns as late as five years after portfolio formation.
Core Idea:
De Bondt and Thaler (1985) reject the market efficiency hypothesis by stating that investors “overreact” to unexpected information. Stocks that experience extreme returns may have subsequent price reversals and such reversals persist in the long-term (3-5 years). They propose that “Contrarian Strategies,” which buy past losers (undervalued stocks) and sell past winners (overvalued stocks), will generate abnormal returns.
Their main findings are the following:
- Overreaction Phenomenon: Extreme price movements in the formation period will be followed by subsequent opposite price movement direction. The more (or less) extreme return experiences, the greater (or smaller) will be the subsequent reversals.
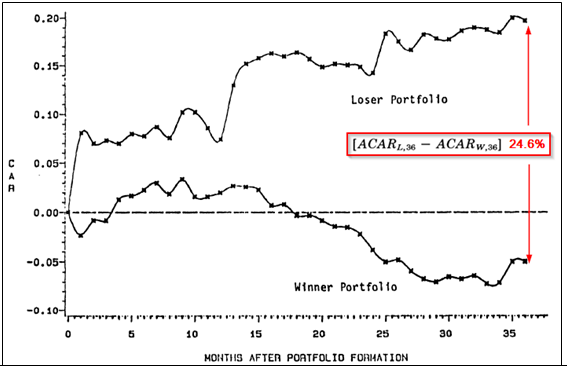
- To test such reversal, the authors compute each stock’s cumulative excess returns (CU) for the prior 36 months starting in Dec 1932. The step is repeated 16 times for all nonoverlapping 3-year period between Jan 1930 and Dec 1977. On each of the 16 relevant portfolio formation dates (Dec 1932, Dec 1935,…, Dec 1977), the CUs are ranked from low to high. Firms in the top 35 stocks are assigned to winner portfolios, and firms in the bottom 35 stocks to the loser portfolios.
- Below graph shows that “losers” based on past 16 nonoverlapping three-year formation period outperform “winners” by 24.6% over the next 3 years. Separately, losers outperform the market by 19.6%, on average, over the next thirty-six months (3 years) after portfolio formation. Winners, on the other hand, earn about 5% less than the market.
- For a formation as short as one year, no reversal is observed.
- A large proportion of the future outperformance of past long-term losers over past long-term winners is found in January.
- The winner portfolio has a higher CAPM Beta (1.369) than the loser portfolio (1.026).
The results are hypothetical results and are NOT an indicator of future results and do NOT represent returns that any investor actually attained. Indexes are unmanaged, do not reflect management or trading fees, and one cannot invest directly in an index. Additional information regarding the construction of these results is available upon request.

About the Author: Jack Vogel, PhD
—
Important Disclosures
For informational and educational purposes only and should not be construed as specific investment, accounting, legal, or tax advice. Certain information is deemed to be reliable, but its accuracy and completeness cannot be guaranteed. Third party information may become outdated or otherwise superseded without notice. Neither the Securities and Exchange Commission (SEC) nor any other federal or state agency has approved, determined the accuracy, or confirmed the adequacy of this article.
The views and opinions expressed herein are those of the author and do not necessarily reflect the views of Alpha Architect, its affiliates or its employees. Our full disclosures are available here. Definitions of common statistics used in our analysis are available here (towards the bottom).
Join thousands of other readers and subscribe to our blog.