Due to the recent IPO craze associated with ALIBABA, we received increased interest from investors wanting to learn more about Chinese stocks. To get a sense for Chinese ADR performance we conducted a high level analysis on Chinese ADRs.
Data Description
Backtested period: 07-01-1995 to 12-31-2013.
Universe: We screen Chinese ADRs in Bloomberg and collect their CUSIPs as the identifier. For missing CUSIPs, we manually update them by searching the internet. As of September 31st, there are 275 Chinese ADRs. We use this list as the starting universe, but should note we could not identify all the Chinese ADRs in our databases.
Portfolio construction: We construct the portfolio on July 1st every year, and buy & hold until June 30th the next year.
Returns are gross of all fees and represent total returns to include dividends and distributions.
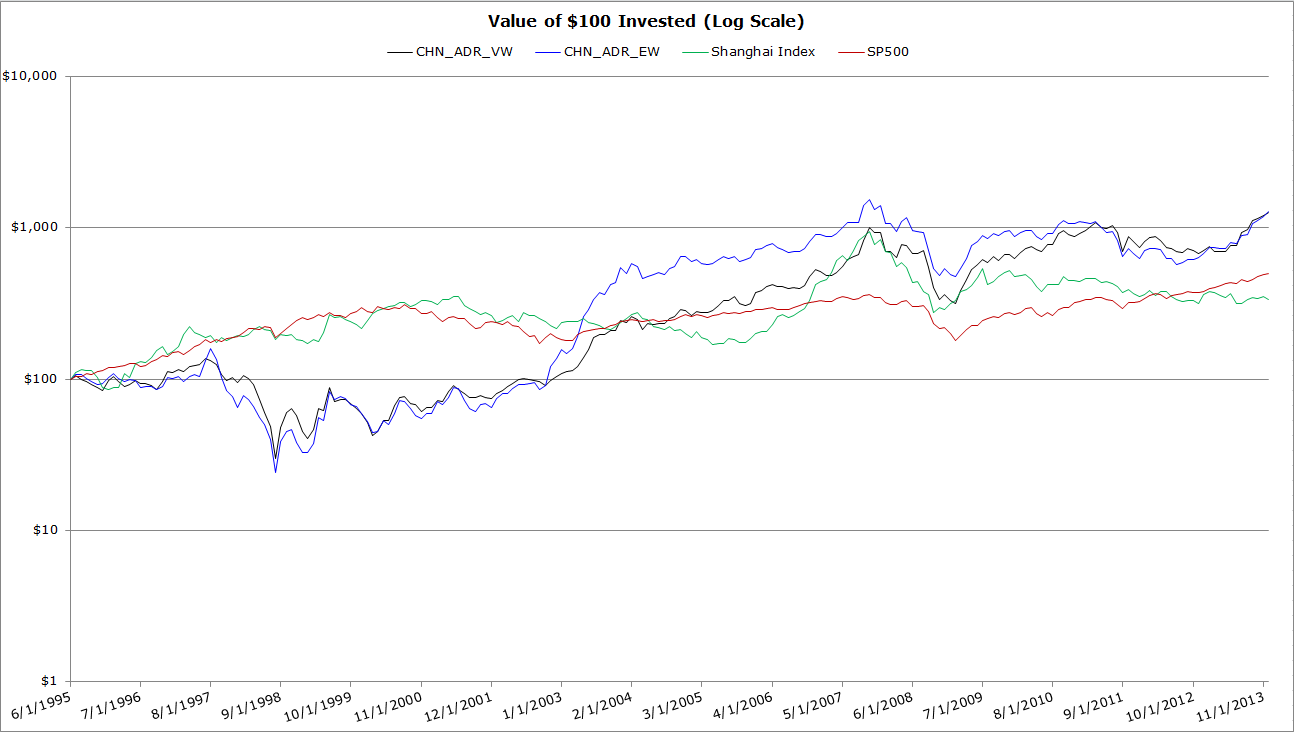
Legend
- CHN_ADR_VW: Annual buy & hold value-weighted Chinese ADR returns.
- CHN_ADR_EW: Annual buy & hold equal-weighted Chinese ADR returns.
- Shanghai Index: Shanghai Exchange Composite Index.
- SP500: SP500 Total Return Index.
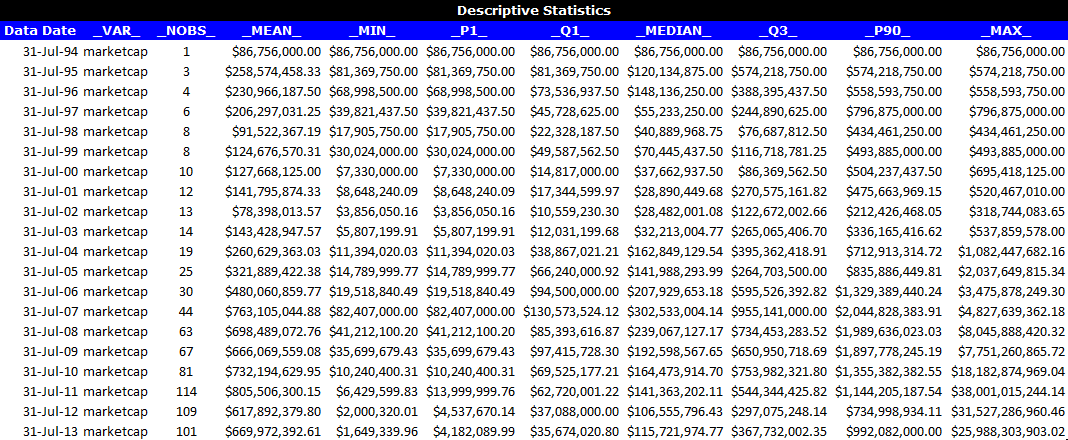
Below is the descriptive statistics on Chinese ADRs which we have identified.
Descriptive Statistics
Due to the small number of stocks and small marketcaps, quantitative analysis is challenging in the early years. Below are the market cap distribution results from 1994 to 2013. Since there is only 1 stock in July 1994, we start our backtest from July-1995.
The results are hypothetical results and are NOT an indicator of future results and do NOT represent returns that any investor actually attained. Indexes are unmanaged, do not reflect management or trading fees, and one cannot invest directly in an index. Additional information regarding the construction of these results is available upon request.
Summary Statistics
The statistics look promising. The value-weighted strategy generates a 14.63% CAGR, which significantly outperforms both the Shanghai composite index and the SP500 total return index. However, the volatility is insane: ~40% volatility, ~78% drawdown.

The results are hypothetical results and are NOT an indicator of future results and do NOT represent returns that any investor actually attained. Indexes are unmanaged, do not reflect management or trading fees, and one cannot invest directly in an index. Additional information regarding the construction of these results is available upon request.
Note that the CHN_ADR_VW is more correlated to SP500 (50.24%) than to Shanghai Index(34.00%).
Invested Growth
The results are hypothetical results and are NOT an indicator of future results and do NOT represent returns that any investor actually attained. Indexes are unmanaged, do not reflect management or trading fees, and one cannot invest directly in an index. Additional information regarding the construction of these results is available upon request.
Major Drawdown Problems? …YES!
Historically, buying and holding Chinese ADRs suffers serious pain. It was scary enough during the 78.20% drawdown between 07-1997 and 08-1998. However, there was a 35.97% drawdown 3 months later, from 11-1998 to 02-1999. What’s more, 4 months later, investors suffered a 52.09% drawdown form 06-1999 to 02-2000. You think this is the end? NO! From 04-2011 to 11-2012, there was a 35% plus drawdown. This type of volatility would test the will of even the most hardened investor.

The results are hypothetical results and are NOT an indicator of future results and do NOT represent returns that any investor actually attained. Indexes are unmanaged, do not reflect management or trading fees, and one cannot invest directly in an index. Additional information regarding the construction of these results is available upon request.
Conclusion
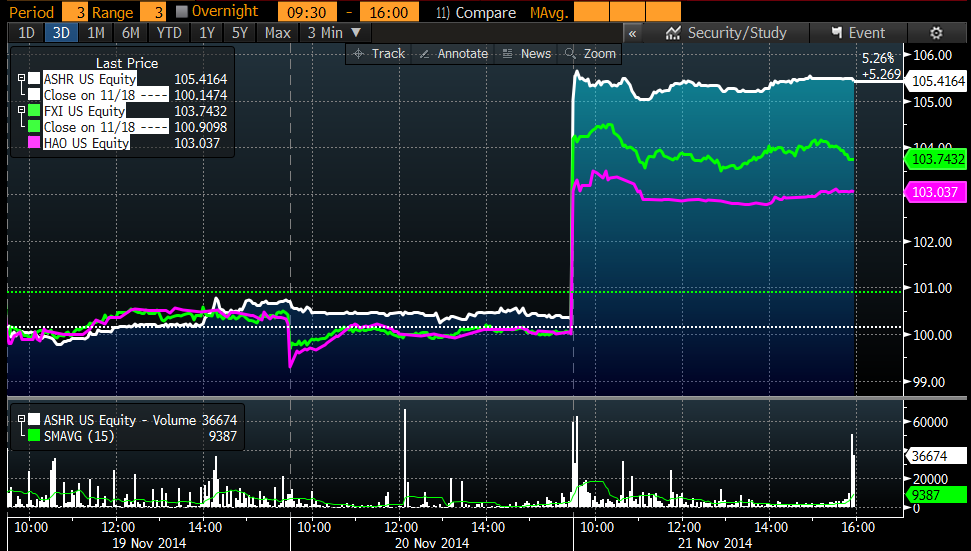
On Friday, for the first time in more than two years, the Chinese central bank cut the interest rate. The market reacted positively. Look at the following ETFs which track the China mainland market: big surge!
For story based investors, they might be excited by this news. However when you look at the evidence, we know the Chinese markets can be extraordinarily volatile and it was better to buy Chinese ADRs instead of the Shanghai Index.
Be careful as you tread into the Chinese markets…

About the Author: Wesley Gray, PhD
—
Important Disclosures
For informational and educational purposes only and should not be construed as specific investment, accounting, legal, or tax advice. Certain information is deemed to be reliable, but its accuracy and completeness cannot be guaranteed. Third party information may become outdated or otherwise superseded without notice. Neither the Securities and Exchange Commission (SEC) nor any other federal or state agency has approved, determined the accuracy, or confirmed the adequacy of this article.
The views and opinions expressed herein are those of the author and do not necessarily reflect the views of Alpha Architect, its affiliates or its employees. Our full disclosures are available here. Definitions of common statistics used in our analysis are available here (towards the bottom).
Join thousands of other readers and subscribe to our blog.