Due to a surge of interest from our “Long Cheap; Short Expensive. Buyer Beware” post, we decided to analyze the impact of changing the net exposure of the Magic Formula Long/Short portfolio (and of course, the impact on returns). Similar to the last post, the portfolios are formed as follows:
- Variable 1: EBIT/TEV (Total enterprise value)
- Variable 2: EBIT/Total capital
To exclude smaller firms, we eliminate all listings below the NYSE 40th percentile, which was around $1.95 billion on 12/31/2013. On 12/31/13, this leaves a universe of ~1050 firms. We then rank the firms on the two variables and form quintiles of average rank of quality and price. The quintile portfolios are formed on 6/30 each year, held for a year, and equal-weighted. All returns are total returns and include the reinvestment of distributions (e.g., dividends). We buy the top quintile (~200 firms) with varying exposure (e.g., 175% long, 75% short, 125% long, 75% short, etc.), go short the bottom quintile (varying exposure), assume a management fee of 2.00%, and a short rebate of 0.25%. All returns are total returns and include the reinvestment of distributions (e.g., dividends). Here are the returns from 1/1/1960-12/31/2013:
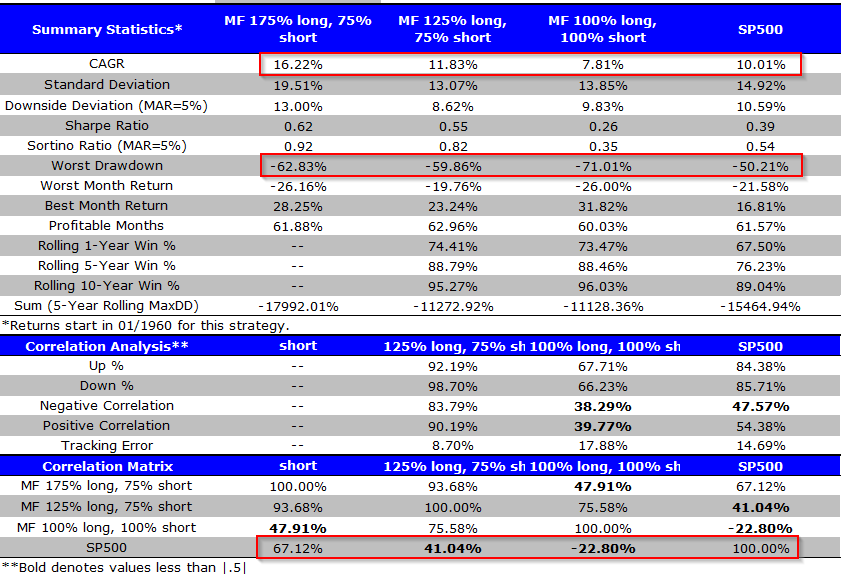
The results are hypothetical results and are NOT an indicator of future results and do NOT represent returns that any investor actually attained. Indexes are unmanaged, do not reflect management or trading fees, and one cannot invest directly in an index. Additional information regarding the construction of these results is available upon request.
A few things worth noting:
- “Net” exposures vary from 100% to 50% to 0%.
- CAGR drops from 16.22% to 11.83% to 7.81% as net exposures drop from 100% to 50% to 0%.
- Correlation to S&P 500 drops from 67.12% to 41.04% to -22.80% as net exposures drop from 100% to 50% to 0%.
- Maximum drawdowns are large across the three strategies, from -59.86% to -71.01% when varying exposures from 100% to 50% to 0%.
The list of drawdowns are in the table below (click to enlarge).
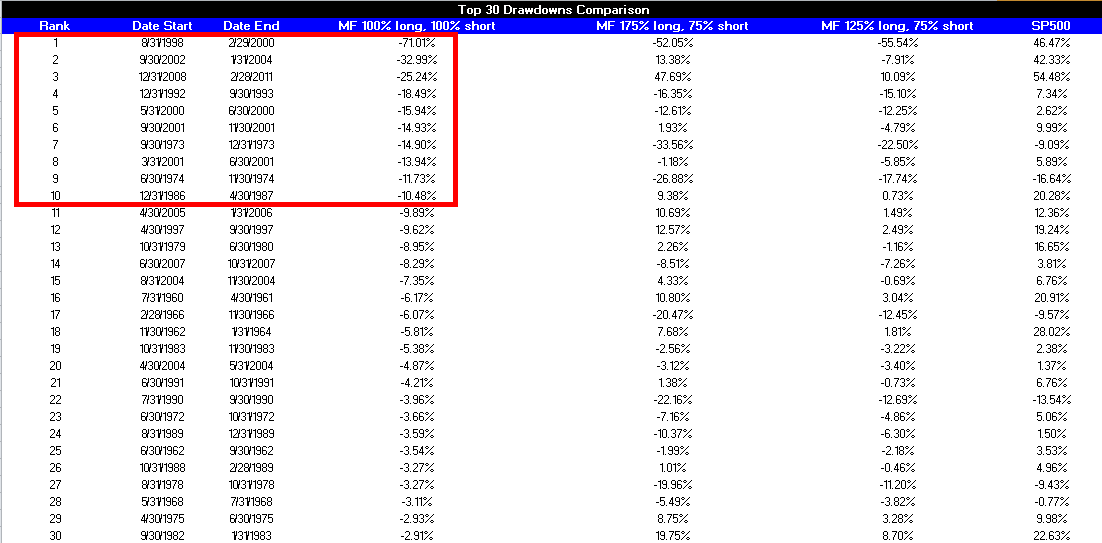
The results are hypothetical results and are NOT an indicator of future results and do NOT represent returns that any investor actually attained. Indexes are unmanaged, do not reflect management or trading fees, and one cannot invest directly in an index. Additional information regarding the construction of these results is available upon request.
All drawdowns are anchored off the market neutral version of the strategy (i.e., we stack rank market neutral drawdowns, and then compare what happened across other mixes of exposures. As we pointed out in our last research post, going long cheap and short expensive is dangerous to your wealth. If you are long value and short growth, and the market has an internet bubble, where growth just gets more and more expensive relative to value, you are going to have a bad time. The markets can–and do–remain irrational longer than you can remain solvent.
Is there a way to improve the Long Cheap/Short Expensive strategy?
One suggestion would be to go the cheaper route, and form a DIY hedge portfolio, as opposed to paying 2% management fees. Build your DIY hedge fund by going long the top quintile of cheap names (varying exposure) and shorting the SP500 (varying exposure). We assume a 0.25%+- funding spread over t and a 0.20% annual transaction cost, as we only need to rebalance the long portfolio annually, and shorting with a SP500 future has minimal costs. Here are the returns from 1/1/1960-12/31/2013:
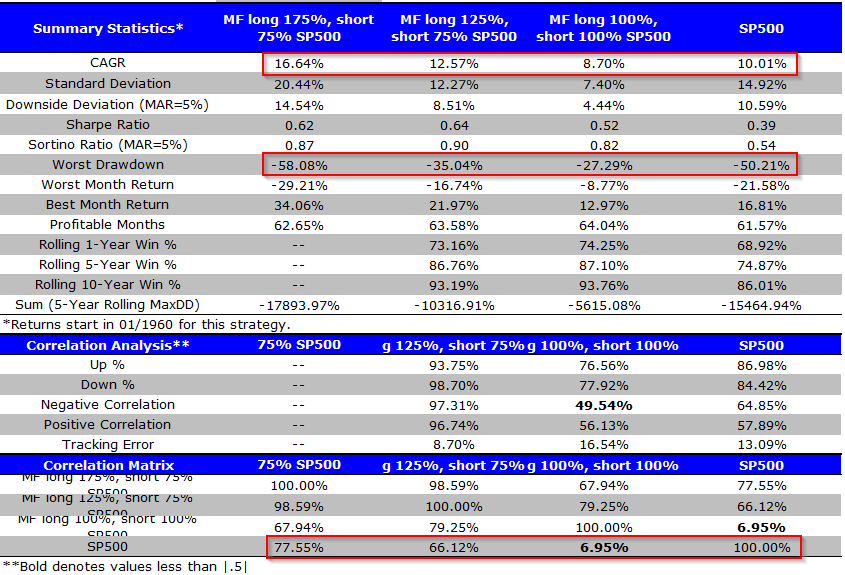
The results are hypothetical results and are NOT an indicator of future results and do NOT represent returns that any investor actually attained. Indexes are unmanaged, do not reflect management or trading fees, and one cannot invest directly in an index. Additional information regarding the construction of these results is available upon request.
A few things worth noting:
- “Net” exposures vary from 100% to 50% to 0%.
- CAGR drops from 16.64% to 12.57% to 8.70% as net exposures drop from 100% to 50% to 0%.
- Correlation to S&P 500 drops from 77.55% to 66.12% to 6.95% as net exposures drop from 100% to 50% to 0%.
- Maximum drawdowns decrease as net exposure decreases. These go from -58.08% to -35.04% to -27.29% when varying exposures from 100% to 50% to 0%.
Comparing this DIY approach to the Magic Formula Long/Short strategy, it appears that if someone wanted a “hedged” exposure to value, shorting with S&P 500 would have help to limit drawdowns. Hedging with S&P is safer than hedging with expensive stocks, when growth stocks are raging higher in an internet bubble. The drawdowns when hedging with S&P 500 are lower in all three net exposure portfolios. Additionally, hedging with S&P 500 can be done fairly simply via futures and ETFs.
Overall, the DIY approach may be interesting if an investor is concerned about market exposure.

About the Author: Jack Vogel, PhD
—
Important Disclosures
For informational and educational purposes only and should not be construed as specific investment, accounting, legal, or tax advice. Certain information is deemed to be reliable, but its accuracy and completeness cannot be guaranteed. Third party information may become outdated or otherwise superseded without notice. Neither the Securities and Exchange Commission (SEC) nor any other federal or state agency has approved, determined the accuracy, or confirmed the adequacy of this article.
The views and opinions expressed herein are those of the author and do not necessarily reflect the views of Alpha Architect, its affiliates or its employees. Our full disclosures are available here. Definitions of common statistics used in our analysis are available here (towards the bottom).
Join thousands of other readers and subscribe to our blog.