Private Equity Performance: What Do We Know?
- Harris, Jenkinson and Kaplan
- A version of the paper can be found here.
- Want a summary of academic papers with alpha? Check out our Academic Research Recap Category.
Abstract:
We study the performance of nearly 1400 U.S. buyout and venture capital funds using a new dataset from Burgiss. We find better buyout fund performance than has previously been documented – performance consistently has exceeded that of public markets. Outperformance versus the S&P 500 averages 20% to 27% over a fund’s life and more than 3% annually. Venture capital funds outperformed public equities in the 1990s, but underperformed in the 2000s. Our conclusions are robust to various indices and risk controls. Performance in Cambridge Associates and Preqin is qualitatively similar to that in Burgiss, but is lower in Thomson Venture Economics.
Alpha Highlight:
Private Equity (PE), quite different from common stocks, is not traded publicly through stock exchanges. With the characteristics of huge initial investments, limited liquidity, long term payback period, and high risk-return, PE funds performance is veiled in secrecy. Despite the large increase in investments in PE funds since 1970, the historical performance of PE funds still remains uncertain, and the disclosures of PE returns are uneven and prone to massive selection bias.
While several commercial enterprises collect performance data, they do no obtain information for all funds. Here is an example of PE performance report, which claims that PE returns since inception are 13.7%:
In this paper, the authors use a new dataset of PE fund-level cash flows from Burgiss. This higher-quality database includes nearly 1400 private equity funds derived from the holdings of over 200 institutional investors. Two types of asset classes of PE are discussed in this paper: Buyout Funds and Venture Capital (VC) funds.
PE funds performance can be measured in various ways, but the most widely used metrics among PE funds are as follows:
- Internal rate of return (IRR): compound annual internal rates of return, calculated on the basis of the actual timing of cash inflows and outflows;
- Multiple of invested capital: compares the sum of all fund contributions by investors to the sum of all fund distributions and the value of unrealized investments, net of fees and carried interest.
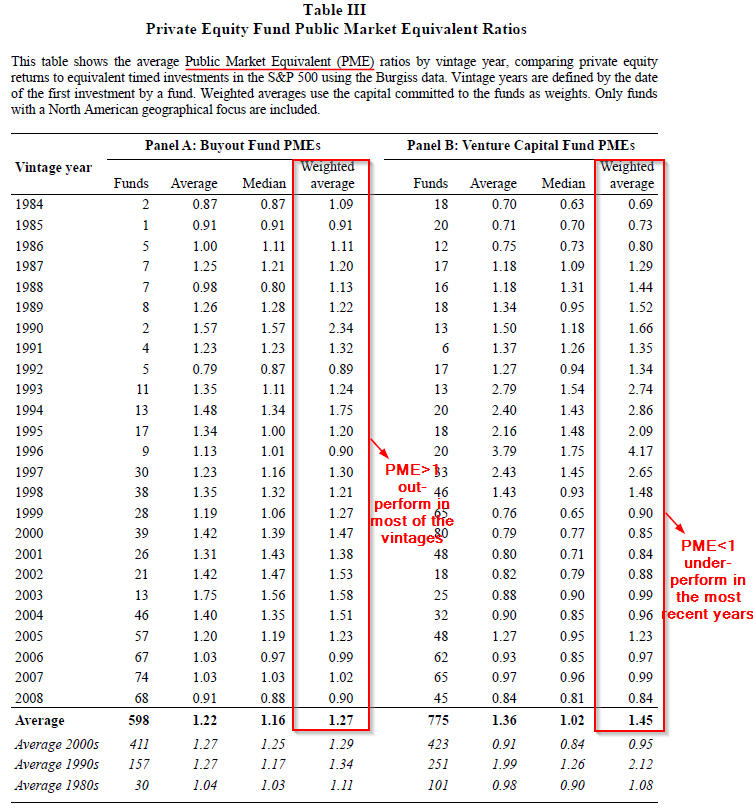
The paper regresses the performance of PE funds in absolute terms and relative to public markets. A method called “Public market equivalent” (Kaplan and Schoar, 2005) is used:
- Public market equivalent (PME): compares how much a PE fund investor actually earned net of fees to what the investor would have earned in an equivalent investment in the public market. If PME exceeds 1.0, then the PE funds out-performed the S&P 500; if PME is lower than 1.0, then funds under-performed the public market.
Key Findings:
- The average U.S. Buyout Fund returns have exceeded those of public markets for most vintages since 1984 (measured by PME). The outperformance versus the S&P 500 averages 20% to 27% over the life of the fund and more than 3% per year.
The results are hypothetical results and are NOT an indicator of future results and do NOT represent returns that any investor actually attained. Indexes are unmanaged, do not reflect management or trading fees, and one cannot invest directly in an index. Additional information regarding the construction of these results is available upon request.
- The average Venture Capital (VC) fund returns, while strong, are misleading. All outperformance relative to public entities is driven by the 1990s when the Internet Bubble was in full effect. Minus the Internet mania, VC has been equivalent to public equity performance, on average.
The table below highlights actual performance for the different types of PE:
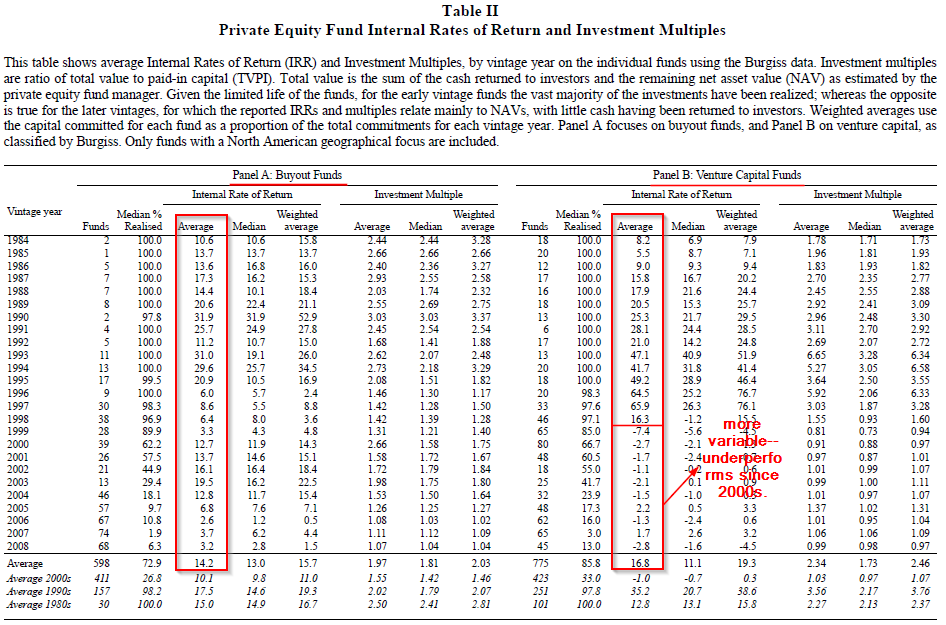
The results are hypothetical results and are NOT an indicator of future results and do NOT represent returns that any investor actually attained. Indexes are unmanaged, do not reflect management or trading fees, and one cannot invest directly in an index. Additional information regarding the construction of these results is available upon request.
In summary, there is some evidence that PE funds can outperform public equity markets, however, this out-performance is limited to buyout funds. Of course, one must consider the FACTS when approaching private equity investments.

About the Author: Wesley Gray, PhD
—
Important Disclosures
For informational and educational purposes only and should not be construed as specific investment, accounting, legal, or tax advice. Certain information is deemed to be reliable, but its accuracy and completeness cannot be guaranteed. Third party information may become outdated or otherwise superseded without notice. Neither the Securities and Exchange Commission (SEC) nor any other federal or state agency has approved, determined the accuracy, or confirmed the adequacy of this article.
The views and opinions expressed herein are those of the author and do not necessarily reflect the views of Alpha Architect, its affiliates or its employees. Our full disclosures are available here. Definitions of common statistics used in our analysis are available here (towards the bottom).
Join thousands of other readers and subscribe to our blog.