Introduction to Finance: Class 8
Risks & Returns
What are risks & returns?
When it comes to financial matters, we all know what risk is — the possibility of losing your hard-earned cash. And most of us understand that a return is what you make on an investment. What many people don’t understand, though, is the relationship between the two. Trade-offs The relationship between risk and return is often represented by a trade-off. In general, the more risk you take on, the greater your possible return. Think of lottery tickets, for example. They involve a very high risk (of losing your money) and the possibility of an extremely high reward (the giant check with lots of zeroes). Or penny stocks: They’re also very risky and yet seem full of amazing potential.
Risk & Return Video 2 (Lecture)
· · · · ·
Key Concepts:
- Expected Returns
- Diversification
- Systematic Risk Principle
- Security Market Line
- Risk-Return Trade-Off
Expected Returns
- Expected returns are based on the probabilities of possible outcomes
- In this context, “expected” means “average” if the process is repeated many times
- The “expected” return does not even have to be a possible return
 Example:
- Three Companies:
- Google – technology firm
- Molson Coors – beverage company
- Wal-Mart – retailer
- U.S. Treasuries (Risk-free Rate)
- S&P 500 (Stock Market Index)
- Determine Expected Returns
- Probability Distribution of Returns
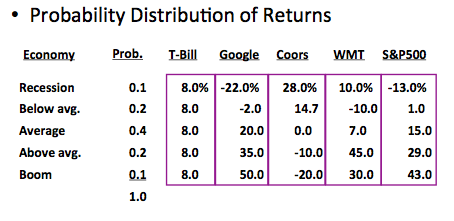
- RTbill = (0.10)(8.0%) + (0.2)(8.0%) + (0.40)(8.0%) + (0.20)(8.0%) + (0.10)(8.0%) = 8.0%
- RGoog = (0.10)(-22.0%) + (0.2)(-2.0%) + (0.40)(20.0%) + (0.20)(35.0%) + (0.10)(50.0%) = 17.4%
- RCoors = (0.10)(28.0%) + (0.2)(14.7%) + (0.40)(0.0%) + (0.20)(-10.0%) + (0.10)(-20.0%) = 1.74%
- RWMT = (0.10)(10.0%) + (0.2)(-10.0%) + (0.40)(7.0%) + (0.20)(45.0%) + (0.10)(30.0%) = 13.8%
- RS&P = (0.10)(-13.0%) + (0.2)(1.0%) + (0.40)(15.0%) + (0.20)(29.0%) + (0.10)(43.0%) = 15.0%
· · · · ·
1. Test Your Knowledge (answers found below)- Suppose you have predicted the following returns for stocks C and T in three possible states of nature:
State Probability C T
Boom 0.3 0.15 0.25 Normal 0.5 0.10 0.20 Recession ??? 0.02 0.01- What is the probability of a recession?
- What are the expected returns of stocks C and T?
- If the risk-free rate is 6.15%, what is each stock’s risk premium?
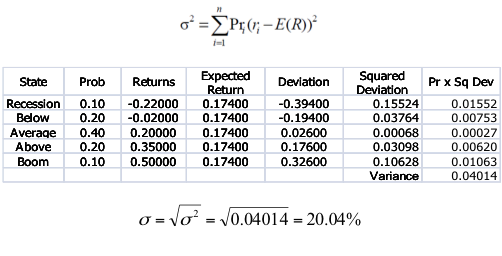
Variance & Standard Deviation
- Variance and standard deviation still measure the volatility of returns
- Using unequal probabilities for the entire range of possibilities
- Weighted average of squared deviations
 Example:
- Calculate variance of Google’s possible returns
 · · · · ·
- What are variance and standard deviation of the returns of stocks C and T based on the expected return you previously calculated?
State Probability C T
Boom 0.3 0.15 0.25 Normal 0.5 0.10 0.20 Recession ??? 0.02 0.01Diversification
Portfolios
- A portfolio is a collection of assets
- The risk-return trade-off for a portfolio is measured by the portfolio expected return and standard deviation
- Portfolio weights: fraction of wealth invested in each asset at beginning of the period
 Example:
- Suppose you have a $10,000 portfolio and you have purchased securities in the following amounts:
- $4000 of Google
- $6000 of Molson Coors
- What are your portfolio weights in each security?


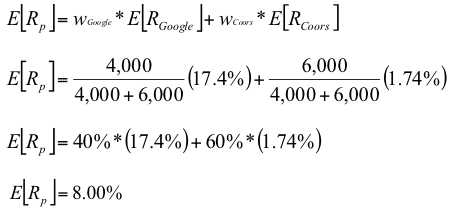
Portfolio Expected Return
- The expected return of a portfolio is the weighted average of the expected returns of the respective assets in the portfolio

- You can also find the expected return by finding the portfolio return in each possible state and computing the expected value as we did with individual securities
Example:
- What is the expected return of a $10,000 portfolio with $4,000 invested in Google and $6,000 invested in Coors?
Portfolio Variance
- Compute the portfolio return for each state:
![]()
- Compute the expected portfolio return
- Compute the portfolio variance and standard deviation using the same formulas as for an individual asset
 Example:
- Calculate the variance and standard deviation of a $10,000 portfolio with $4,000 invested in Google and $6,000 invested in Coors?
- Calculate portfolio return in each state and expected return


![]()
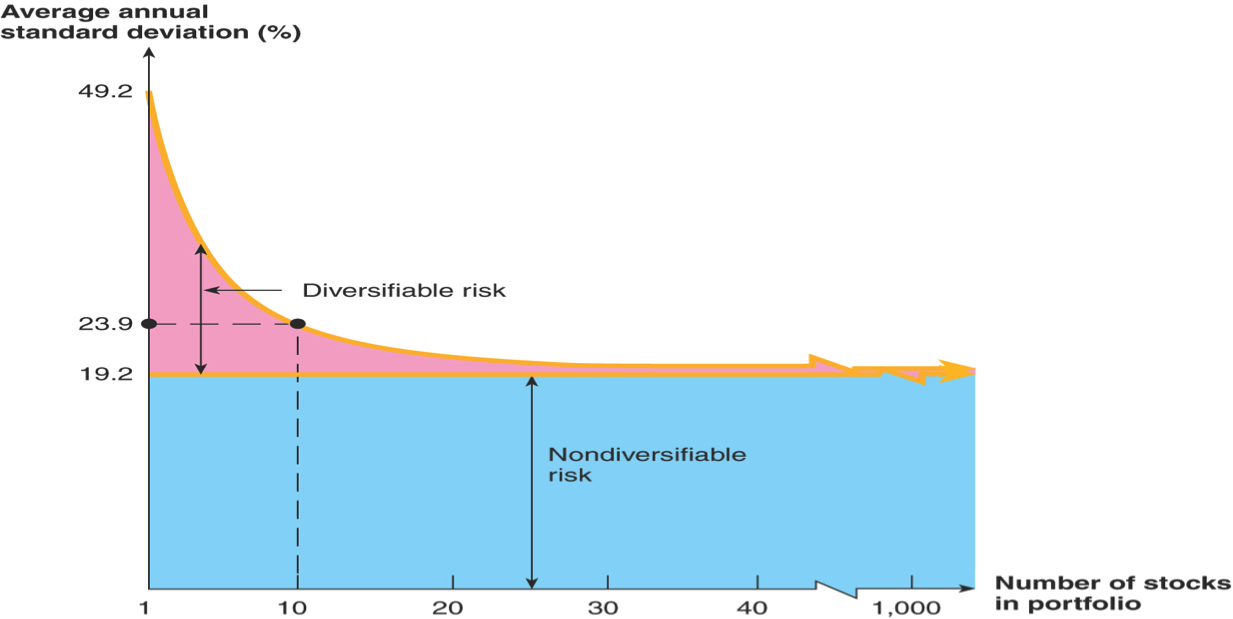
Portfolio Diversification
- Portfolio diversification is the investment in several different asset classes or sectors
- Diversification is not just holding a lot of assets
- If you own 50 Internet stocks, then you are not diversified
- If you own 50 stocks that span 20 different industries, then you are diversified
- The Principle of Diversification:
- Diversification can substantially reduce the variability of returns without an equivalent reduction in expected returns
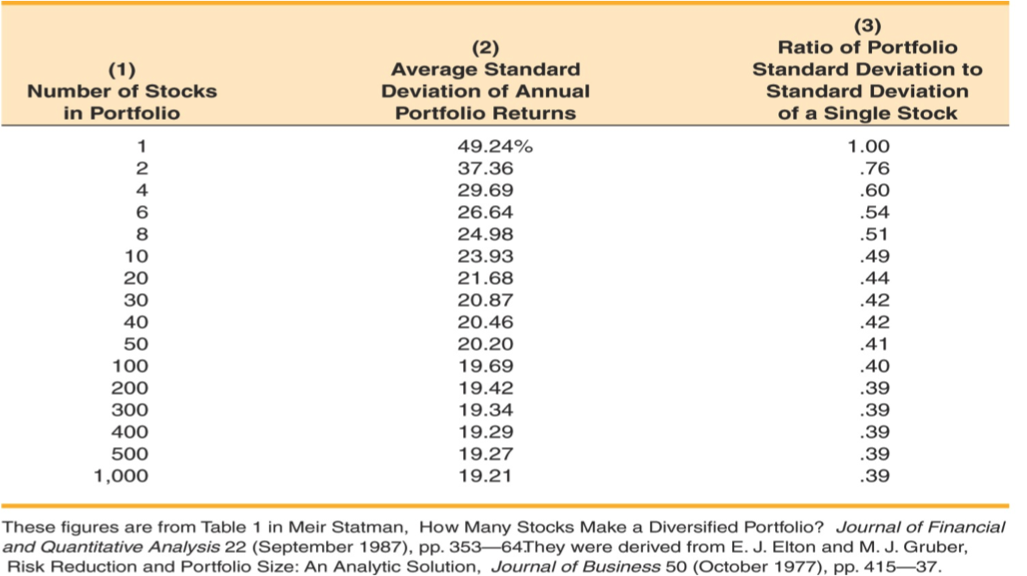
- However, there is a minimum level of risk that cannot be diversified away – that is the systematic portion
 · · · · ·
- Consider the following information
State Probability X Y
Boom .25 15% 10% Normal .60 10% 9% Recession .15 5% 10%- What is the expected return and standard deviation for a portfolio with an investment of $6,000 in asset X and $4,000 in asset Y?
Systematic Risk Principle
- There is a reward for bearing risk
- There is not a reward for bearing risk unnecessarily
- The expected return on a risky asset (and thus its risk premium) depends only on that asset’s systematic risk since unsystematic risk can be diversified away
Expected vs. Unexpected Returns
- Realized returns are generally not equal to expected returns
- There is the expected component and the unexpected component
- At any point in time, the unexpected return can be either positive or negative
- Over time, the average of the unexpected component is zero
Announcements and News
- Announcements and news contain both an expected component and a surprise component
- It is the surprise component that affects a stock’s price and therefore its return
- This is very obvious when we watch how stock prices move when an unexpected announcement is made, or earnings are different from anticipated
Systematic vs. Unsystematic Factors
- Systematic Factors
- Risk factors that affect a large number of assets
- Also known as non-diversifiable risk or market risk
- Includes changes in GDP, inflation, interest rates, etc.
- Example: employment
- Unsystematic Factors
- Risk factors that affect a limited number of assets
- Also known as unique risk and asset-specific risk
- Includes such things as labor strikes, part shortages, etc.
Decomposition of Returns
- Total Realized Return = expected return + unexpected return
- Unexpected return = systematic portion + unsystematic portion
- Total Realized Return = Expected return + Systematic portion + Unsystematic portion
Total Risk
- Total risk = systematic risk + unsystematic risk
- The standard deviation of returns (s) is a measure of total risk
- For well-diversified portfolios, unsystematic risk is very small
- Consequently, the total risk for a diversified portfolio is essentially equivalent to the systematic risk
Measuring Systematic Risk
- How do we measure systematic risk?
- Market is well diversified → its movements result of systematic risk only
- Analyze co-movements of asset returns with market returns
- We use the beta coefficient (b) to measure systematic risk
![]()
- What does beta tell us?
- β=1 → asset has same systematic risk as market
- β<1 → asset has less systematic risk than market
- β>1 → asset has more systematic risk than market
- Firm’s beta can be found via Yahoo
· · · · ·
4. Test Your Knowledge (answers found below)- Consider the following information:
Standard Deviation Beta
Security C 20% 1.25
Security K 30% 0.95
- Which security has more total risk?
- Which security has more systematic risk?
- Which security should have the higher expected return?
Risk-Return Trade-Off
Portfolio Betas
- Consider our portfolio invested 40% in Google and 60% in Coors. Given that βGoogle=1.12 and βCoors=0.79, what is βPortfolio?
- The beta of a portfolio is simply the weighted average of the betas of the assets in the portfolio:
- βPortfolio = wGoogle x βGoogle + wCoors x βCoors
- βPortfolio= 40% x 1.12 + 60% x 0.79
- βPortfolio= 0.92
- The beta of a portfolio is simply the weighted average of the betas of the assets in the portfolio:
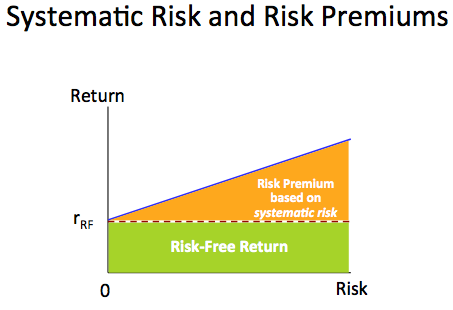
Beta and the Risk Premium
- Remember: risk premium = expected return – risk-free rate
- The higher the beta, the higher the systematic risk
- the higher the beta, the higher the expected return
- the higher the beta, the higher the risk premium
- Can we define the relationship between the risk premium and beta so that we can estimate the expected return
- YES!
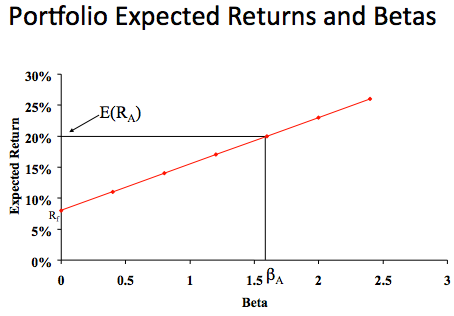
Reward-to-Risk Ratio
- The reward-to-risk ratio is the slope of the line illustrated in the previous example
- Slope = (E(RA) – Rf) / (βA – 0)
- Reward-to-risk ratio for previous example = (20 – 8) / (1.6 – 0) = 7.5
- What if an asset has a reward-to-risk ratio of 8 (implying that the asset plots above the line)?
- What if an asset has a reward-to-risk ratio of 7 (implying that the asset plots below the line)?
Market Equilibrium
- In equilibrium, all assets and portfolios must have the same reward-to-risk ratio, and each must equal the reward-to-risk ratio for the market
Security Market Line
- The security market line (SML) is the representation of market equilibrium
- The slope of the SML is the reward-to-risk ratio: (E(RM) – Rf) / βM
- But since the beta for the market is ALWAYS equal to one, the slope can be rewritten
- Slope = E(RM) – Rf = market risk premium
- SML & Equilibrium
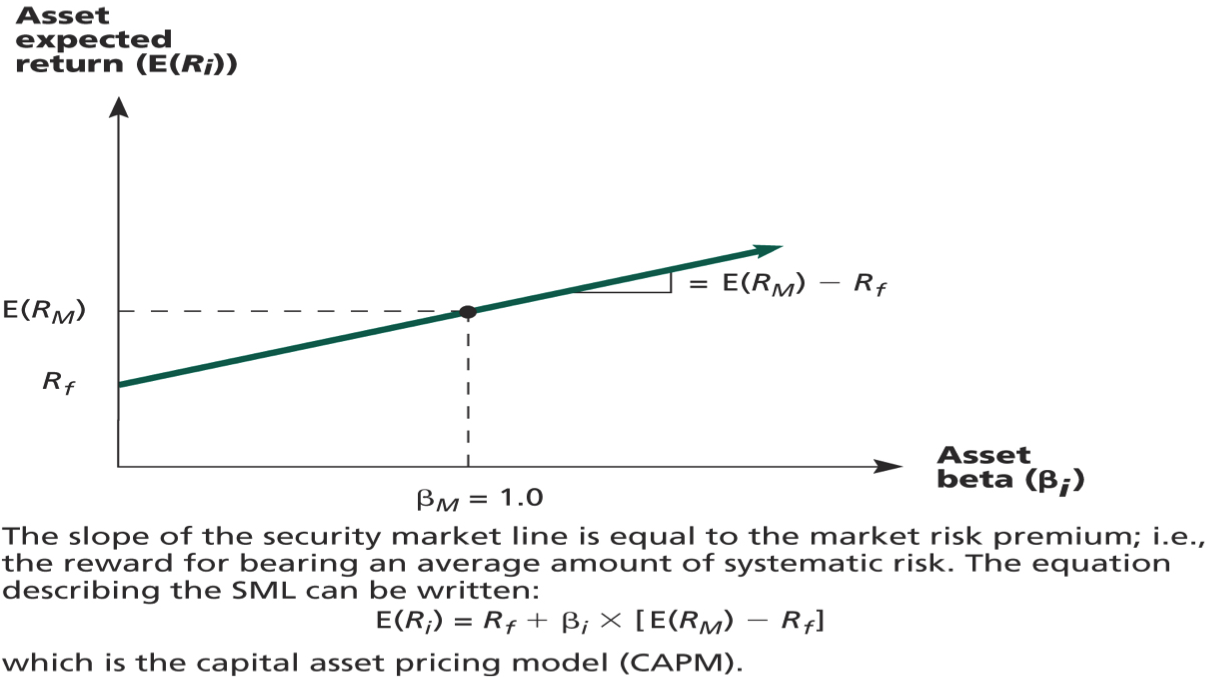
Capital Asset Pricing Model (CAPM)
- The capital asset pricing model (CAPM) defines the relationship between risk and return
- E(RA) = Rf + βA(E(RM) – Rf)
- If we know an asset’s systematic risk, we can use the CAPM to determine its expected return
- This is true whether we are talking about financial assets or physical assets
Example:
- Consider the betas for each of the assets given earlier. If the risk-free rate is 3.15% and the market risk premium is 9.5%, what is the expected return for each?
Security Beta Expected Return
Google 1.12 3.15 + 1.12(9.5) = 13.79%
Coors 0.79 3.15 + 0.79(9.5) = 10.66%
Wal-Mart 0.25 3.15 + 0.25(9.5) = 5.53%
Campbell Soup 0.34 3.15 + 0.34(9.5) = 6.38%
Apple 1.57 3.15 + 1.57(9.5) = 18.07%
Microsoft 0.98 3.15 + 0.98(9.5) = 12.46%
· · · · ·
- The risk-free rate is 4%, and the expected return on the market is 12%. What is the required return on an asset with a beta of 1.5?
- What is the required return on a portfolio consisting of 40% of the asset above and the rest in an asset with an average amount of systematic risk?
Wrap-Up
- The expected return on a risky asset depends only on that asset’s systematic risk
- We use beta to measure systematic risk
- If we know an asset’s systematic risk, we can use the CAPM to determine its required return
- Factors affecting expected return:
- Pure time value of money – measured by the risk-free rate
- Reward for bearing systematic risk – measured by the market risk premium
- Amount of systematic risk – measured by beta
· · · · ·
Solutions
1.
- Probability of recession = 1 – .3 – .5 = .2
- Expected return of C = (.3)(15%) + (.5)(10%) + (.2)(2%) = 9.9%
- Expected return of T = (.3)(25%) + (.5)(20%) + (.2)(1%) = 17.7%
- Risk premium = expected return – risk-free rate
- Risk premium (C) = 9.9% – 6.15% = 3.75%
- Risk premium (T) = 17.7% – 6.15% = 11.55%
2.
 3.
3.


4.
- Security K since it has the most risk (higher standard deviation)
- Security C has more systematic risk, since it has a higher Beta
- Security C should has a higher expected return since it has a higher Beta, and thus higher systematic risk. Remember a risk premium on an asset only depends on its systematic risk!
5.
- E(RA) = Rf + βA(E(RM) – Rf)
- E(RA) = 4% + 1.5*(12% – 4%) = 16%
- Average amount of systematic risk = Beta = 1
- E(Ravg) = 4% + 1*(12% – 4%) = 12%
- Expected return on portfolio = (40%)(16%) + (60%)(12%) = 13.6%
For more classes:
Education Series

About the Author: Victoria Tran
—
Important Disclosures
For informational and educational purposes only and should not be construed as specific investment, accounting, legal, or tax advice. Certain information is deemed to be reliable, but its accuracy and completeness cannot be guaranteed. Third party information may become outdated or otherwise superseded without notice. Neither the Securities and Exchange Commission (SEC) nor any other federal or state agency has approved, determined the accuracy, or confirmed the adequacy of this article.
The views and opinions expressed herein are those of the author and do not necessarily reflect the views of Alpha Architect, its affiliates or its employees. Our full disclosures are available here. Definitions of common statistics used in our analysis are available here (towards the bottom).
Join thousands of other readers and subscribe to our blog.