A recent blog post suggests that value investing in the tech sector is a waste of time.
The article tells a compelling story and argues for 2 points:
- Successful tech stock investing is done when the stocks are dear, not when they are cheap.
- Tech companies should not get credit for huge piles of cash on their balance sheets.
The author then makes the claim that you can’t make big money in cheap tech stocks and buying cheap tech doesn’t work. We thought the blog post was thought-provoking and it inspired us to conduct a quick empirical analysis to ascertain if there was any truth to the claims.
Do value-investing principles matter in the technology space?
First, a quick description of the study we conduct from 1980-2013.
- Identify firms above NYSE 20th percentile for market cap that have information to calculate enterprise multiples.
- In today’s terms, this equates to a universe that looks at stocks with a market capitalization of $790mm and up.
- Split firms into deciles based on EBIT/TEV
- Only example firms with SIC codes related to the high-technology sector
- 5 HiTec Business Equipment — Computers, Software, and Electronic Equipment
- 3570-3579
- 3622-3622 Industrial controls
- 3660-3692
- 3694-3699
- 3810-3839
- 7370-7372 Services – computer programming and data processing
- 7373-7373 Computer integrated systems design
- 7374-7374 Services – computer processing, data prep
- 7375-7375 Services – information retrieval services
- 7376-7376 Services – computer facilities management service
- 7377-7377 Services – computer rental and leasing
- 7378-7378 Services – computer maintenance and repair
- 7379-7379 Services – computer related services
- 7391-7391 Services – R&D labs
- 8730-8734 Services – research, development, testing labs
- 5 HiTec Business Equipment — Computers, Software, and Electronic Equipment
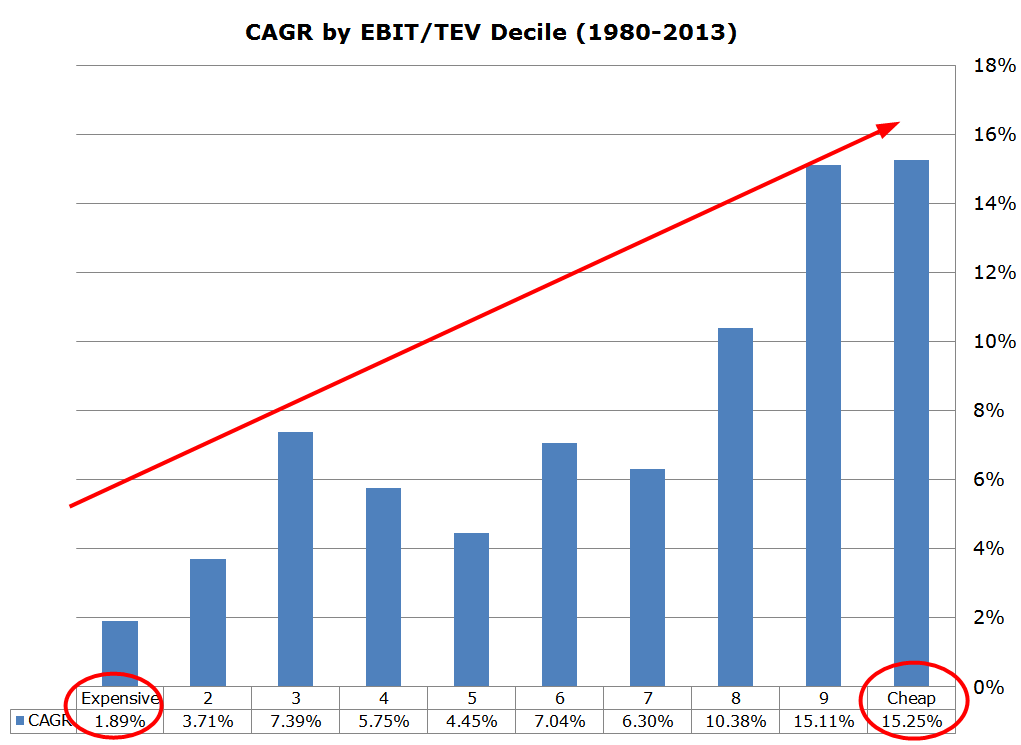
What do the results look like?
The results are hypothetical results and are NOT an indicator of future results and do NOT represent returns that any investor actually attained. Indexes are unmanaged, do not reflect management or trading fees, and one cannot invest directly in an index. Additional information regarding the construction of these results is available upon request.
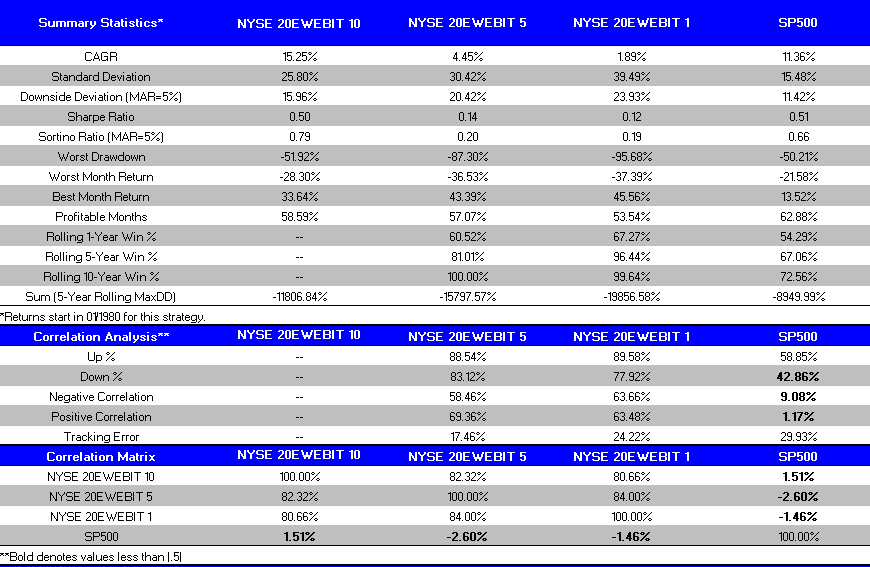
The chart above clearly shows there is a relationship between price paid and future performance. The cheapest decile of tech firms earn 15.25% a year, on average, whereas, the expensive decile tech firms earn 1.89%/year. Certainly seems to refute the argument proposed by the author that value investing doesn’t apply to tech firms… Here are some additional statistics comparing the most expensive decile, the mid-range decile, and the cheap decile.
- NYSE 20 EW EBIT 10 = equal-weight, annual rebalanced portfolio of cheapest EBIT/TEV tech stocks
- NYSE 20 EW EBIT 5 = equal-weight, annual rebalanced portfolio of 40-50% EBIT/TEV tech stocks
- NYSE 20 EW EBIT 1 = equal-weight, annual rebalanced portfolio of most expensive EBIT/TEV tech stocks
The results are hypothetical results and are NOT an indicator of future results and do NOT represent returns that any investor actually attained. Indexes are unmanaged, do not reflect management or trading fees, and one cannot invest directly in an index. Additional information regarding the construction of these results is available upon request.
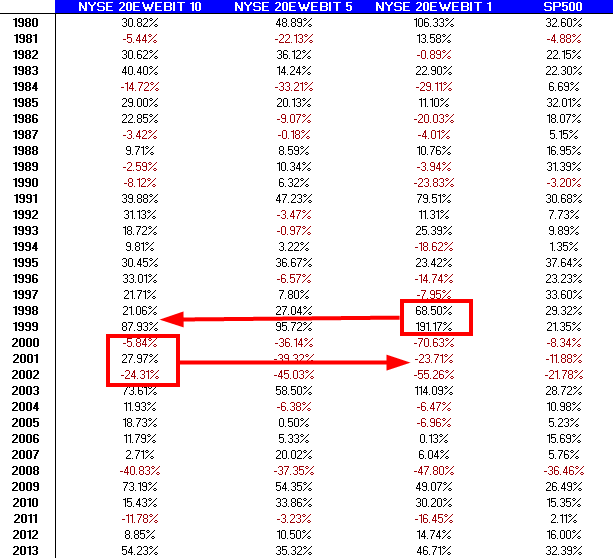
Here are the annual returns for the 4 return streams from 1980 to 2013. You’ll notice some dramatic swings in relative performance around the Internet Bubble!
The results are hypothetical results and are NOT an indicator of future results and do NOT represent returns that any investor actually attained. Indexes are unmanaged, do not reflect management or trading fees, and one cannot invest directly in an index. Additional information regarding the construction of these results is available upon request.

About the Author: Wesley Gray, PhD
—
Important Disclosures
For informational and educational purposes only and should not be construed as specific investment, accounting, legal, or tax advice. Certain information is deemed to be reliable, but its accuracy and completeness cannot be guaranteed. Third party information may become outdated or otherwise superseded without notice. Neither the Securities and Exchange Commission (SEC) nor any other federal or state agency has approved, determined the accuracy, or confirmed the adequacy of this article.
The views and opinions expressed herein are those of the author and do not necessarily reflect the views of Alpha Architect, its affiliates or its employees. Our full disclosures are available here. Definitions of common statistics used in our analysis are available here (towards the bottom).
Join thousands of other readers and subscribe to our blog.