I sat down with Wes Gray–who also contributes frequently on this blog under the title Wesley Gray, Ph.D.–and Toby Carlisle–who runs the great blog over at greenbackd.com. Wes and Toby (WT) have a book coming out that is dedicated to finding the holy grail of systematic value investing, or Quantitative Value (QV). I’ve been following their coat tails in my 4-part series, which is meant to capture the high-level elements of what will be published in their new book.
In this post, I’ve summed up some results Wes sent my way, did a little analysis using the Turnkey Analyst screening tool, and shared some of the results from my interview below.
Quantitative Value (QV)
After several intermediate stops, we have arrived at our final destination: the fourth and final installment of our 4-part series on optimizing a systematic value investing approach to identifying low risk, high quality, undervalued stocks that generate market beating returns. In this concluding post, we will take our readers through WT’s entire investing process, from soup-to-nuts, first by defining our screening universe, and then by applying the elements of WT’s Quantitative Value strategy.
The strategy has been sketched in the first 3 parts of our 4-part series:
- Part 1 covering how to avoid permanent capital impairment
- Part 2 which explores how to identify cheap stocks, and our two-part quality assessment
- Part 3a, how to identify a franchise, and Part 3b, how to measure financial strength.
Below is a visual overview of our Quantitative Value investment process:
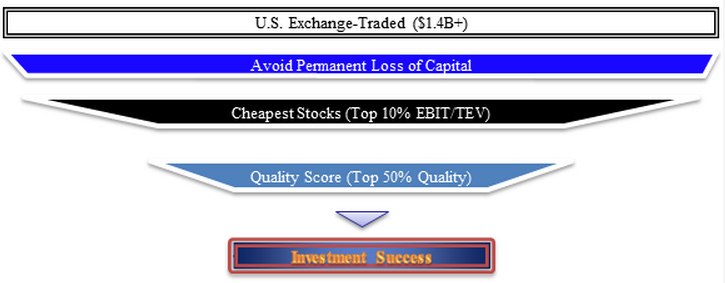
Defining the Universe
The first step in the QV investing process involves setting some broad parameters that will form the boundaries of a universe for further screening, and some definitions around the QV methodologies and process. There are several reasons WT place some limits around the stocks they will consider. A critical aspect involves liquidity, which is related to the size of the stocks under consideration. In general, including stocks that are too small, with their wide bid/ask spreads and limited liquidity which can lead to large moves with small volumes, can lead to significantly overstated returns. In other words, if WT include small stocks in their universe, the backtested results may generate phenomenal returns, but these returns may be unobtainable in the real world, even when operating with a small amounts of capital. In order to honestly assess the QV approach, WT eliminates all stocks below the 40th percentile breakpoint of the NYSE by market capitalization and WT market-weight (also referred to as “value-weight” in academic literature) portfolios. Market-weighted portfolios are constructed similar to the S&P 500 index, which weights each firm within the index according to its market value. As of December 31, 2011, the 40% NYSE market cap breakpoint corresponded to a market capitalization of approximately $1.4 billion. WT also exclude from the data set specific securities, including ADRs, REITS, ETFs and others, as well as industries such as utilities and financials, which present various problems for the QV approach. Another requirement is that the firms WT analyze must have an adequate number of years of data to draw from, as some of the QV metrics require that WT analyze financial data over the past 8 years.
Another factor WTconsider in the analysis is transaction costs. In order to accurately account for the potential effect of transactions costs on the real-world implementation of our strategy, WT minimize them by rebalancing only once per year, and by investing in only large, liquid stocks. WT also attempt to avoid other shortcomings of backtesting: WT use the CRSP database, which avoids survivorship bias since it includes historical corporate action and delisting information, and WT lag the data by 6 months in order to avoid look-ahead bias.
We ran the quantitative model the other day and, utilizing the 40th percentile breakpoint of the NYSE, we established our initial universe consisting of 829 stocks. Next, we “clean” this universe of investable stocks, by eliminating those that pose a risk of permanent capital impairment, as discussed in Part 1 of our series. Accordingly, we apply WT’s three basic tools, in order to avoid the risk of financial statement manipulation, fraud or financial distress (bankruptcy) in a particular stock.
The first tool involves two accruals metrics that measure the stock and flow of accruals. If the company is aggressively using accruals, and scores above the 95th percentile of our universe, we eliminate it. Looking over the output from our model, we see that of our 829 stocks, 40 of them fail our accruals test, and are eliminated. Our second tool is the PROBM model which employs financial statistics to predict the risk of financial statement manipulation and fraud, once again eliminating those falling in the top 5% of our universe. In our current model, PROBM has identified an additional 39 stocks that are statistically likely to be engaged in manipulation, and we eliminate these from consideration. Finally, we use our third tool, a logistic regression employing accounting and equity market-based metrics to determine an overall probability of financial distress; once again, we eliminate the top 5% of the output, which in our current model results in the exclusion of an additional 39 stocks. As a result of our “cleaning” process that eliminates stocks that could cause permanent capital impairment, our total screenable universe has been reduced from 829 stocks to 711 stocks.
Now that we have prepared our universe for further screening by eliminating those stocks that pose the greatest risk of permanently impairing our capital, we are ready to proceed to the next phase of our process: identifying the cheapest stocks.
Look at Cheap Stuff
In our Part 2 post, we discussed the horse race we ran to determine the best metric to use for maximizing the value anomaly, as well as the winner of our race, which was Enterprise Yield using EBIT. We therefore look to our thoroughbred, Enterprise Yield using EBIT, to sort our universe into deciles. We are now focused on the cheapest decile, and have further reduced our universe from 711 stocks, to a leaner and cheaper group of 71 stocks.
Find High Quality Cheap Stuff
The next stage of our process involves sorting this very cheap decile of stocks on the basis of their quality. In our Part 3a and Part 3b posts, we described the two ways we evaluate stocks for quality.
Our first quality assessment tool, discussed in Part 3a, involves a review of the firm’s franchise, as measured by its returns on capital and assets, as well as its margin strength. Once we have calculated our four franchise metrics, we determine how each individual metric stacks up on a percentile basis versus our universe, and we then take an average of those four percentile scores to determine our overall franchise quality score. For example, Questcor Pharmaceuticals scores better than 95% of our universe for our four franchise calculations. Now that’s a franchise!
Our second quality assessment tool measures financial strength, and we discuss in Part 3b of our series the various metrics we use, which are closely related to Joseph Piotroski’s F_Score. Our own financial strength score, the FS_Score, involves 10 separate metrics that measure a firm’s profitability, stability and recent operating improvements. Once we have measured each financial strength metric and awarded a 1 or a 0 for each, we arrive at a score from 1 to 10, which equates to an overall financial strength score ranging from 10% to 100%. Returning to our Questcor Pharmaceuticals example, we see that the firm generates an FS_Score of 9, which equates to a financial strength quality score of 90%. Now we take the average of our two individual quality measures to arrive at a composite quality score. For Questcor Pharmaceuticals, we average the firm’s franchise score of 95%, and its financial strength score of 90%, to arrive at our overall quality score of 93%.
Find High Quality Cheap Stuff
Now that we have sorted our top value decile by quality, we invest in the top 50% of the names, further reducing the universe in which we actually invest to approximately 35 stocks, which are rebalanced yearly. In order to get a sense for the how our investment methodology integrates into the output of our model, take a look at the output below, which provides summary details relating to the top 10 names generated by our Quantitative Value process.
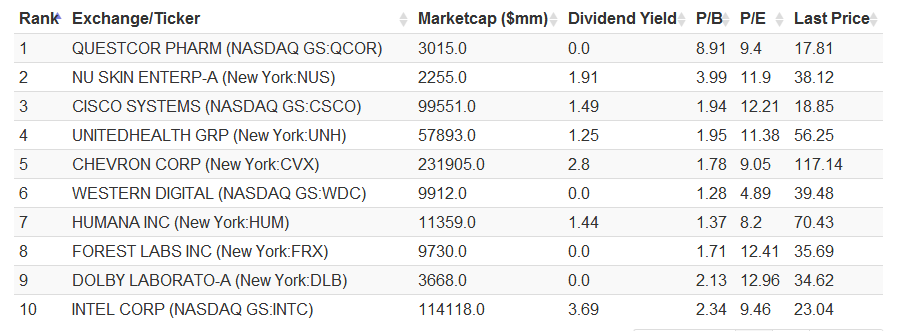
The results are hypothetical results and are NOT an indicator of future results and do NOT represent returns that any investor actually attained. Indexes are unmanaged, do not reflect management or trading fees, and one cannot invest directly in an index. Additional information regarding the construction of these results is available upon request.
Let’s take a closer look at Questcor Pharmaceuticals. From the output above, we can see that the company’s market capitalization of $3.0 billion is well above our 40% breakpoint threshold of $1.4 billion. The company has generated a safety score of 3/3, indicating there are no obvious statistical red flags that would indicate we run a risk of capital impairment via financial statement manipulation, fraud or financial distress. The company is cheap, with an EBIT/EV yield of 19%, placing it between the median and the 75th percentile of our top decile for cheapness. Moreover, the company generates a composite quality score of 93%, indicating that it possesses a franchise and is showing strong statistical signs of financial strength.
Questcor is by no means perfect: http://www.dailyfinance.com/2012/09/27/is-questcor-pharmaceuticals-a-bargain-or-bust/
And the market is pissed about recent news from Aetna:
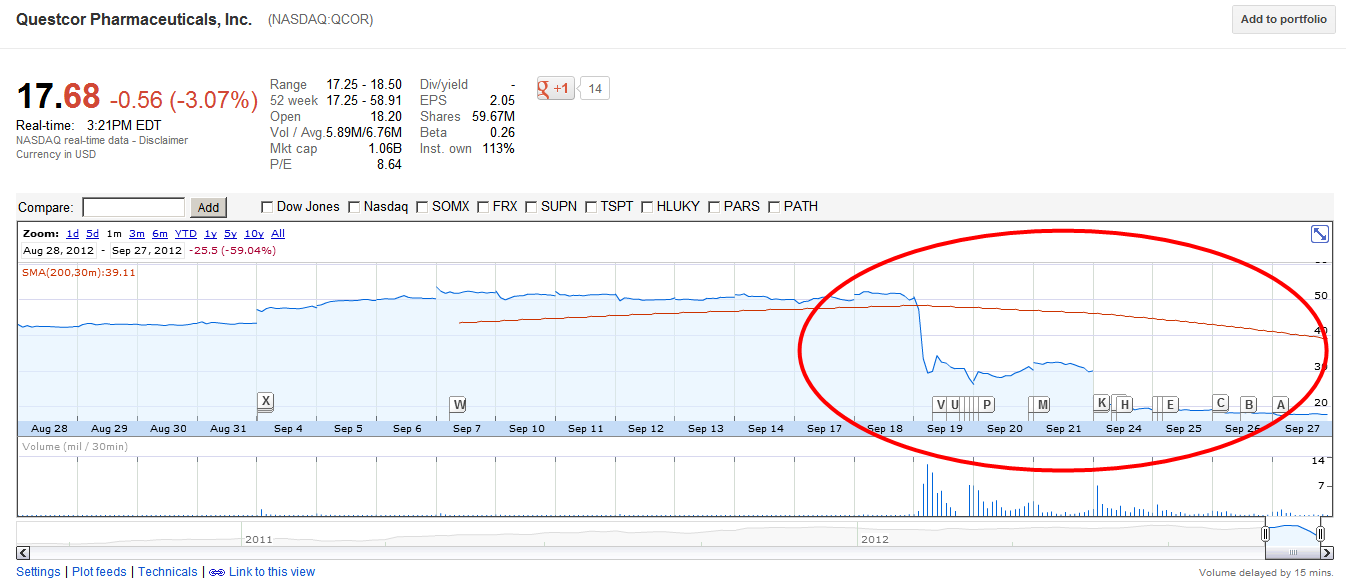
But one thing is clear: Questcor has been an excellent firm and it is currently cheap.
How does it work?
Many aspects of the process above involve analytical processes that you might expect to see from a human analyst reviewing whether to invest. And that is by design. WT based their quantitative methodology on longstanding value investing principles and on well-established academic research from across the field of finance. WT have also taken care to be conservative in establishing their methodology, eliminating securities that might skew their results or present real-world trading difficulties, and minimized backtesting risks such as survivorship, look-ahead bias, and delistings.
Now let’s see how the QV strategy looks from a risk and return perspective by reviewing the results of WT backtests, which cover the period 1974 through 2011:
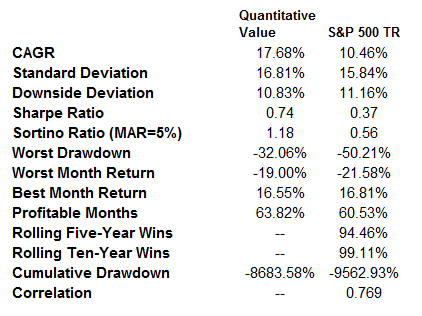
The results are hypothetical results and are NOT an indicator of future results and do NOT represent returns that any investor actually attained. Indexes are unmanaged, do not reflect management or trading fees, and one cannot invest directly in an index. Additional information regarding the construction of these results is available upon request.
The results speak for themselves. The simulated quantitative value approach generates a compound annual growth rate of 17.7% over the period 1974 through 2011, dramatically outperforming the S&P 500 index, which returned a 10.5% CAGR. The outperformance comes with reduced volatility, as is demonstrated by its strong Sharpe ratio of 0.74, versus the S&P’s 0.37. Its Sortino of 1.18 is also superior to the 0.56 for the market. The strategy also performed with lower drawdowns, with a maximum drawdown over the period of -32%, versus -50% for the S&P.
We believe that the investing framework WT have outlined above represents a reasonable approach to investing for investors who want to preserve capital and beat the markets over the long-term. In summary, we already knew that fundamentals-based investing worked, but now WT have confirmed that systematic value investing works as well.
This concludes our 4-part series covering a systematic value investing approach to identifying low risk, high quality, undervalued stocks that generate market beating returns. We hope you have enjoyed walking through the different parts of our model.
If you want to dig a LOT deeper, you can read an in-depth treatment of the quantitative value process in a book co-written by Wesley R. Gray Ph.D., along with Toby Carlisle at www.greenbackd.com. The book will be available in December.
Pre-order today!
http://www.amazon.com/Quantitative-Value-Web-Site-Factor-based/dp/1118328078
I sat down with Wes Gray–who also contributes frequently on this blog under the title Wesley Gray, Ph.D.–and Toby Carlisle–who runs the great blog over at greenbackd.com. Wes and Toby (WT) have a book coming out that is dedicated to finding the holy grail of systematic value investing, or Quantitative Value (QV). I’ve been following their coat tails in my 4-part series, which is meant to capture the high-level elements of what will be published in their new book.
In this post, I’ve summed up some results Wes sent my way, did a little analysis using the Turnkey Analyst screening tool, and shared some of the results from my interview below.
Quantitative Value (QV)
After several intermediate stops, we have arrived at our final destination: the fourth and final installment of our 4-part series on optimizing a systematic value investing approach to identifying low risk, high quality, undervalued stocks that generate market beating returns. In this concluding post, we will take our readers through WT’s entire investing process, from soup-to-nuts, first by defining our screening universe, and then by applying the elements of WT’s Quantitative Value strategy.
The strategy has been sketched in the first 3 parts of our 4-part series:
- Part 1 covering how to avoid permanent capital impairment
- Part 2 which explores how to identify cheap stocks, and our two-part quality assessment
- Part 3a, how to identify a franchise, and Part 3b, how to measure financial strength.
Below is a visual overview of our Quantitative Value investment process:
Defining the Universe
The first step in the QV investing process involves setting some broad parameters that will form the boundaries of a universe for further screening, and some definitions around the QV methodologies and process. There are several reasons WT place some limits around the stocks they will consider. A critical aspect involves liquidity, which is related to the size of the stocks under consideration. In general, including stocks that are too small, with their wide bid/ask spreads and limited liquidity which can lead to large moves with small volumes, can lead to significantly overstated returns. In other words, if WT include small stocks in their universe, the backtested results may generate phenomenal returns, but these returns may be unobtainable in the real world, even when operating with a small amounts of capital. In order to honestly assess the QV approach, WT eliminates all stocks below the 40th percentile breakpoint of the NYSE by market capitalization and WT market-weight (also referred to as “value-weight” in academic literature) portfolios. Market-weighted portfolios are constructed similar to the S&P 500 index, which weights each firm within the index according to its market value. As of December 31, 2011, the 40% NYSE market cap breakpoint corresponded to a market capitalization of approximately $1.4 billion. WT also exclude from the data set specific securities, including ADRs, REITS, ETFs and others, as well as industries such as utilities and financials, which present various problems for the QV approach. Another requirement is that the firms WT analyze must have an adequate number of years of data to draw from, as some of the QV metrics require that WT analyze financial data over the past 8 years.
Another factor WTconsider in the analysis is transaction costs. In order to accurately account for the potential effect of transactions costs on the real-world implementation of our strategy, WT minimize them by rebalancing only once per year, and by investing in only large, liquid stocks. WT also attempt to avoid other shortcomings of backtesting: WT use the CRSP database, which avoids survivorship bias since it includes historical corporate action and delisting information, and WT lag the data by 6 months in order to avoid look-ahead bias.
We ran the quantitative model the other day and, utilizing the 40th percentile breakpoint of the NYSE, we established our initial universe consisting of 829 stocks. Next, we “clean” this universe of investable stocks, by eliminating those that pose a risk of permanent capital impairment, as discussed in Part 1 of our series. Accordingly, we apply WT’s three basic tools, in order to avoid the risk of financial statement manipulation, fraud or financial distress (bankruptcy) in a particular stock.
The first tool involves two accruals metrics that measure the stock and flow of accruals. If the company is aggressively using accruals, and scores above the 95th percentile of our universe, we eliminate it. Looking over the output from our model, we see that of our 829 stocks, 40 of them fail our accruals test, and are eliminated. Our second tool is the PROBM model which employs financial statistics to predict the risk of financial statement manipulation and fraud, once again eliminating those falling in the top 5% of our universe. In our current model, PROBM has identified an additional 39 stocks that are statistically likely to be engaged in manipulation, and we eliminate these from consideration. Finally, we use our third tool, a logistic regression employing accounting and equity market-based metrics to determine an overall probability of financial distress; once again, we eliminate the top 5% of the output, which in our current model results in the exclusion of an additional 39 stocks. As a result of our “cleaning” process that eliminates stocks that could cause permanent capital impairment, our total screenable universe has been reduced from 829 stocks to 711 stocks.
Now that we have prepared our universe for further screening by eliminating those stocks that pose the greatest risk of permanently impairing our capital, we are ready to proceed to the next phase of our process: identifying the cheapest stocks.
Look at Cheap Stuff
In our Part 2 post, we discussed the horse race we ran to determine the best metric to use for maximizing the value anomaly, as well as the winner of our race, which was Enterprise Yield using EBIT. We therefore look to our thoroughbred, Enterprise Yield using EBIT, to sort our universe into deciles. We are now focused on the cheapest decile, and have further reduced our universe from 711 stocks, to a leaner and cheaper group of 71 stocks.
Find High Quality Cheap Stuff
The next stage of our process involves sorting this very cheap decile of stocks on the basis of their quality. In our Part 3a and Part 3b posts, we described the two ways we evaluate stocks for quality.
Our first quality assessment tool, discussed in Part 3a, involves a review of the firm’s franchise, as measured by its returns on capital and assets, as well as its margin strength. Once we have calculated our four franchise metrics, we determine how each individual metric stacks up on a percentile basis versus our universe, and we then take an average of those four percentile scores to determine our overall franchise quality score. For example, Questcor Pharmaceuticals scores better than 95% of our universe for our four franchise calculations. Now that’s a franchise!
Our second quality assessment tool measures financial strength, and we discuss in Part 3b of our series the various metrics we use, which are closely related to Joseph Piotroski’s F_Score. Our own financial strength score, the FS_Score, involves 10 separate metrics that measure a firm’s profitability, stability and recent operating improvements. Once we have measured each financial strength metric and awarded a 1 or a 0 for each, we arrive at a score from 1 to 10, which equates to an overall financial strength score ranging from 10% to 100%. Returning to our Questcor Pharmaceuticals example, we see that the firm generates an FS_Score of 9, which equates to a financial strength quality score of 90%. Now we take the average of our two individual quality measures to arrive at a composite quality score. For Questcor Pharmaceuticals, we average the firm’s franchise score of 95%, and its financial strength score of 90%, to arrive at our overall quality score of 93%.
Find High Quality Cheap Stuff
Now that we have sorted our top value decile by quality, we invest in the top 50% of the names, further reducing the universe in which we actually invest to approximately 35 stocks, which are rebalanced yearly. In order to get a sense for the how our investment methodology integrates into the output of our model, take a look at the output below, which provides summary details relating to the top 10 names generated by our Quantitative Value process.
The results are hypothetical results and are NOT an indicator of future results and do NOT represent returns that any investor actually attained. Indexes are unmanaged, do not reflect management or trading fees, and one cannot invest directly in an index. Additional information regarding the construction of these results is available upon request.
Let’s take a closer look at Questcor Pharmaceuticals. From the output above, we can see that the company’s market capitalization of $3.0 billion is well above our 40% breakpoint threshold of $1.4 billion. The company has generated a safety score of 3/3, indicating there are no obvious statistical red flags that would indicate we run a risk of capital impairment via financial statement manipulation, fraud or financial distress. The company is cheap, with an EBIT/EV yield of 19%, placing it between the median and the 75th percentile of our top decile for cheapness. Moreover, the company generates a composite quality score of 93%, indicating that it possesses a franchise and is showing strong statistical signs of financial strength.
Questcor is by no means perfect: http://www.dailyfinance.com/2012/09/27/is-questcor-pharmaceuticals-a-bargain-or-bust/
And the market is pissed about recent news from Aetna:
But one thing is clear: Questcor has been an excellent firm and it is currently cheap.
How does it work?
Many aspects of the process above involve analytical processes that you might expect to see from a human analyst reviewing whether to invest. And that is by design. WT based their quantitative methodology on longstanding value investing principles and on well-established academic research from across the field of finance. WT have also taken care to be conservative in establishing their methodology, eliminating securities that might skew their results or present real-world trading difficulties, and minimized backtesting risks such as survivorship, look-ahead bias, and delistings.
Now let’s see how the QV strategy looks from a risk and return perspective by reviewing the results of WT backtests, which cover the period 1974 through 2011:
The results are hypothetical results and are NOT an indicator of future results and do NOT represent returns that any investor actually attained. Indexes are unmanaged, do not reflect management or trading fees, and one cannot invest directly in an index. Additional information regarding the construction of these results is available upon request.
The results speak for themselves. The simulated quantitative value approach generates a compound annual growth rate of 17.7% over the period 1974 through 2011, dramatically outperforming the S&P 500 index, which returned a 10.5% CAGR. The outperformance comes with reduced volatility, as is demonstrated by its strong Sharpe ratio of 0.74, versus the S&P’s 0.37. Its Sortino of 1.18 is also superior to the 0.56 for the market. The strategy also performed with lower drawdowns, with a maximum drawdown over the period of -32%, versus -50% for the S&P.
We believe that the investing framework WT have outlined above represents a reasonable approach to investing for investors who want to preserve capital and beat the markets over the long-term. In summary, we already knew that fundamentals-based investing worked, but now WT have confirmed that systematic value investing works as well.
This concludes our 4-part series covering a systematic value investing approach to identifying low risk, high quality, undervalued stocks that generate market beating returns. We hope you have enjoyed walking through the different parts of our model.
If you want to dig a LOT deeper, you can read an in-depth treatment of the quantitative value process in a book co-written by Wesley R. Gray Ph.D., along with Toby Carlisle at www.greenbackd.com. The book will be available in December.
Pre-order today!
http://www.amazon.com/Quantitative-Value-Web-Site-Factor-based/dp/1118328078

About the Author: David Foulke
—
Important Disclosures
For informational and educational purposes only and should not be construed as specific investment, accounting, legal, or tax advice. Certain information is deemed to be reliable, but its accuracy and completeness cannot be guaranteed. Third party information may become outdated or otherwise superseded without notice. Neither the Securities and Exchange Commission (SEC) nor any other federal or state agency has approved, determined the accuracy, or confirmed the adequacy of this article.
The views and opinions expressed herein are those of the author and do not necessarily reflect the views of Alpha Architect, its affiliates or its employees. Our full disclosures are available here. Definitions of common statistics used in our analysis are available here (towards the bottom).
Join thousands of other readers and subscribe to our blog.