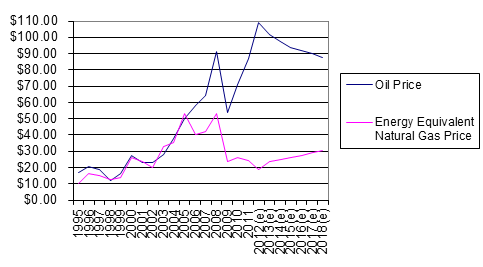
The Turnkey PhD is always on the lookout for arbitrage opportunities, so when I showed him the below chart, which depicts the $/BTU spread between natural gas and oil, he got interested quickly:
If you focus on the 2012 spread, you will note that we are in an extreme condition versus the historical spread. I also added futures prices for both commodities, and you can see that the market is saying the spread will narrow over the next few years. So what is going on here? Looking back, it appears the two commodities traded near parity from 1995 through 2005, after which time all hell broke loose. Several factors contribute to the shapes of these curves. On the oil side, a weak dollar, growth in Asian consumption, and a reduction in spare capacity all contributed to rising oil prices over the past 10 years. The price of NYMEX crude oil for 2012 is currently at ~$109/barrel, having nearly quintupled over the past 10 years, from $22/barrel in 2002. The oil futures market is currently in backwardation, with the near to intermediate term spot prices having been bid up based on fear of a conflict with Iran, which would impact supply. Meanwhile, on the gas side, the shale gas revolution flooded the market with new supplies of natural gas, leading to a dramatic reduction in prices over the past roughly 5 years or so. The current front month spot price is ~$2.70/MCF, which matches prices last seen 10 years ago. The market predicts a gradual increase in gas prices over the next few years, as more natural gas is used for electricity and industrial applications, and as the U.S. begins to export liquified natural gas abroad.
Just to give you sense for the methodology behind the above graph, there are about 6 million BTUs in a barrel of oil, while there are about 1 million BTUs in an MCF of gas. This means that if you want to compare them on a $/BTU basis, the mathematical rule of thumb is simple: just take the natural gas price, and multiply by 6, and this will tell you how many dollars you have to pay for approximately 6 million BTUs of either oil or gas.
The point here, however, is that while BTU parity between these markets is roughly 6X, today we are seeing a spread of approximately 35X (avg. oil for 2012 of $109 / avg. nat gas for calendar 2012 of $3.12 = 35X). Put another way, the oil to natural gas prices ratio is almost SIX TIMES HIGHER than if they traded at parity. That can’t last, right? There are ways we can substitute natural gas for oil, which would tend to compress this spread back towards its equilibrium of 6 times, so it seems like we should be able to put on some kind of trade that takes advantage of that spread compression. Ok, you say, well what could we do?
One obvious way to arbitrage the spread would be through the futures market. You could go out a few years, and buy the natural gas futures, and sell the oil futures of the same date. Then every so often you could roll over the position. The problem with this approach is that, as seen above, the market is already showing prices will compress, so you have to bet the actual rate of compression takes place faster than the market says it will. Even if the spread does compress faster, there aren’t huge returns to be made here, and there is a real risk that the spread will compress more slowly than the market thinks.
Another approach would be to go long natural gas exploration and production (E&P) companies, such as Chesapeake Energy, and short crude oil companies, such as Exxon. A few problems here. First, it’s somewhat difficult to construct a good market neutral hedge. You could use ETFs or put together dollar- or beta-neutral baskets of these stocks, but it would be hard to get the pure spread compression exposure we are looking for. Second, here again, you have the stock market which presumably prices in the spread compression we see in the futures market, so as with the futures market you might ultimately be at the mercy of the rate of compression.
You could try investing in companies focused on the markets that focus on the spread, as with for natural gas for vehicles, since burning natural gas in cars makes sense at these spreads. But that’s really a bet on compressed natural gas, which is not to say that it won’t work out well, but that it’s just not a spread bet. You might invest in LNG terminals. Cheniere Energy Partners just got $2 billion from The Blackstone Group, which obviously thinks this is a good way to go. But for the public market investor, these LNG stocks have already been bid up, and as with market for natural gas for vehicles, LNG terminals are only on one side of the trade: the natural gas side.
What about gas-to-liquids (“GTL”) technology, through which natural gas is converted into synthetic oil products? The technology for manufacturing synthetic fuel is not new. During the second world war, Germany was seeking oil for its war effort, and began experimenting with the Fischer-Tropsch process as a means of deriving synthetic fuel from its abundant coal resources. More recently, several major oil companies have used natural gas as a feedstock for generating synthetic crude oil. Examples include Chevron’s Escravos project in Nigeria, and Shell’s Pearl GTL plant in Qatar. The problem here is that the economics of these plants are embedded in large oil companies, so we can’t invest in them directly. Or can we? Before we write off this approach allow me to suggest that perhaps you don’t need to be Chevron or Shell to make such an investment.
Despite that the projects above are huge, it turns out that you don’t necessarily need to rely on economies of scale to make the technology work. It’s not rocket science – the Germans were doing it in the 20s. These giant plants can be scaled down to a very modest size and still generate attractive returns on capital. The technology is not prohibitively complex, although you do need a sophisticated engineer who understands Fischer-Tropsch and can design and run your plant. Many of the parts required to construct such a GTL plant are common and can be purchased off the shelf, and put together by a knowledgeable and experienced contractor. Once constructed, a skid mounted module can be trucked out to a site where it is connected to a natural gas source.
Let’s walk through the economics of a potential project.
Ok, assume you are an entrepreneur focused on taking advantage of the BTU spread discussed above. You hire an engineer who tells you he can construct a small GTL plant for $15 million. The plant requires feed gas of 1 million MCF per year, which is roughly equivalent to 1 million MMBTU. The output of the plant will be 4.6 million gallons of diesel fuel, which is roughly 650,000 MMBTU. Therefore, for every BTU of input gas, you get 0.65 BTU of diesel output, which means the plant operates at 65% efficiency.
Next you approach a small producer of natural gas, who owns some small gas fields. You tell him you want a reliable supply of 1 million MCF of gas per year for the next 8 years to supply your project, but you’ll give him a great price. The producer has 30-40 wells in one field he is prepared to dedicate to the project. Below is the futures curve for natural gas versus the fixed $4.50 per MCF you are prepared to pay him over the next 8 years:
This seems like a pretty good deal for the gas producer, and he agrees to supply the gas for the project.
Next you want to find a company who you can enter into an offtake agreement with for the diesel. It just so happens that there is a large local distributor with a fleet of trucks who is interested in a long term contract. Below is a futures curve for diesel fuel versus the fixed price $2.75 per gallon offer you make to the distributor:
This looks like a pretty good deal for the distributor, and he agrees to buy all the diesel the project can produce for the next 8 years.
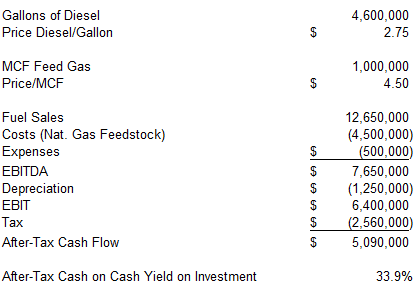
Now let’s take a look at the single year economics on the plant, and see what our cash flows will look like:
We can see the project generates approximately $12.6 million in revenues, with the feedgas cost of goods of $4.5 million. There are $0.5 million of expenses, which includes the cost of an engineer to keep the plant running. We assume 8 year straight-line depreciation, and a 40% tax rate. With ~$5 million in cash flow, your yearly after-tax cash yield on your initial $15 million investment is roughly 34%. What do the project IRRs look like?
It appears you make your money back in year 3, with unlevered IRRs climbing into the mid-teens range in year 4, and into the 21-34% range for years 5-8.
You’re going to want a strong return like this based on the many risks you run. The project might take longer than you think to get started, and you may suffer cost overruns. The plant efficiency may be lower than 65%. Your $0.5 million of expenses per year may be understated. You have counter party risk, with the possibility that either your gas producer or diesel buyer goes bankrupt.
But there are ways to manage around these problems, and even if that 30%+ got whittled down to something lower, you might still do very well. Additionally, there could be ways to finance the project with debt that would enhance the economics dramatically. And if you could put a few of these deals together, you might start to get smart about how to build, manage and finance them efficiently. Perhaps best of all, this kind of investment captures the current and future spread in the market and takes advantage of it in a way that you can’t really do in the public markets. If you can lock in the supply and distribution arrangements described above you should be able to generate strong returns for many years.
There are entrepreneurs out there today working on projects very similar to this, and they are looking for financing. With the BTU spread between oil and natural gas at historic highs, perhaps its time for investors to start looking at these projects. We’re here to tell you that you don’t need to be a major oil company to make money on the giant BTU spread. You just need to find the right project with the right agreements in place.
About the Author: David Foulke
—
Important Disclosures
For informational and educational purposes only and should not be construed as specific investment, accounting, legal, or tax advice. Certain information is deemed to be reliable, but its accuracy and completeness cannot be guaranteed. Third party information may become outdated or otherwise superseded without notice. Neither the Securities and Exchange Commission (SEC) nor any other federal or state agency has approved, determined the accuracy, or confirmed the adequacy of this article.
The views and opinions expressed herein are those of the author and do not necessarily reflect the views of Alpha Architect, its affiliates or its employees. Our full disclosures are available here. Definitions of common statistics used in our analysis are available here (towards the bottom).
Join thousands of other readers and subscribe to our blog.


