Supply and Demand Shifts in the Shorting Market
- Lauren Cohen, Karl B. Diether and Chirstopher J. Malloy
- A version of the paper can be found here.
- This write-up was adapted from a research report by Haiping Huang, Lin Xiong, Nanxing Wei, Sheng Xu and Sining Liu from my finance 794 class
Abstract:
Using proprietary data on stock loan fees and quantities from a large institutional investor, we examine the link between the shorting market and stock prices. Employing a unique identification strategy, we isolate shifts in the supply and demand for shorting. We find that shorting demand is an important predictor of future stock returns: An increase in shorting demand leads to negative abnormal returns of 2.98% in the following month. Second, we show that our results are stronger in environments with less public information flow, suggesting that the shorting market is an important mechanism for private information revelation.
Data Sources:
The authors use a proprietary database of stock lending activity from a large institutional investor. The dataset is based on a novel 4-year panel, which consist of actual loan prices and quantities. Daily contract level data include: rebate rates, shares on loan, collateral amounts, collateral/market rates, estimated income from each loan, and broker firm names for the entire universe of lending activity for the firm. The data is available from September, 1999 to August, 2003.
Discussion:
Empirically, we see negative returns on stocks with high short interest–this result is fairly intuitive. However, nobody has really had the data to drill down into the securities lending market until now. The paper here provides a new framework for testing how stock prices respond to activity in the shorting market: isolate supply and demand shifts in the equity lending market.
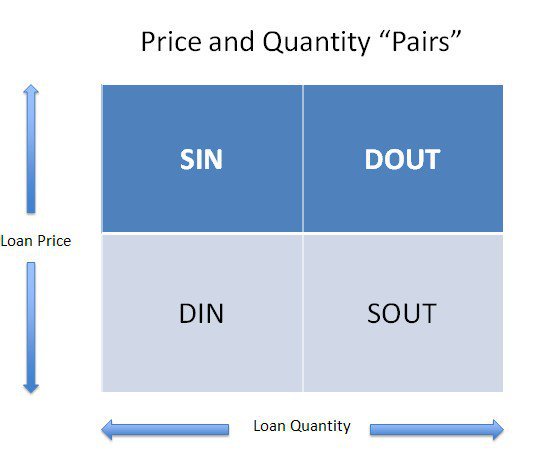
In microeconomics 101, we learn that if quality and price increase simultaneously, the demand curve must have shifted outward. Therefore, an increase both in shorting cost (price) and shorting volume (quantity), signals increase in shorting demand: more capital is betting that price of stock will drop even with a higher explicit cost of betting on this drop. The authors can also identify explicit shifts in supply by identifying cases where shorting volume goes down and the cost of shorting falls.
While identifying shifts in supply and shifts in demand are simple, pinpointing why there are shifts in supply and demand is more opaque.
To control for a variety of variables that may affect supply and demand shifts, the authors examine the following regression model:

- DIN is a dummy variable for an inward demand shift.
- DOUT is a dummy variable for an outward demand shift;
- SIN is a dummy variable for an inward supply shift
- SOUT is a dummy variable for an outward supply shift;
- Momentum effect: r-1 is last month’s return. r-12, -2 is the return from month t – 12 to t – 2.
- IO (institutional ownership effect): fraction of shares holds by institution.
- Volume: the average daily share turnover, testing liquidity and market friction.
The left hand side variable represents returns after adjusting for size and book-to-market effects. DIN, DOUT, SIN, and SOUT are categorical variables determined based on the figure below:
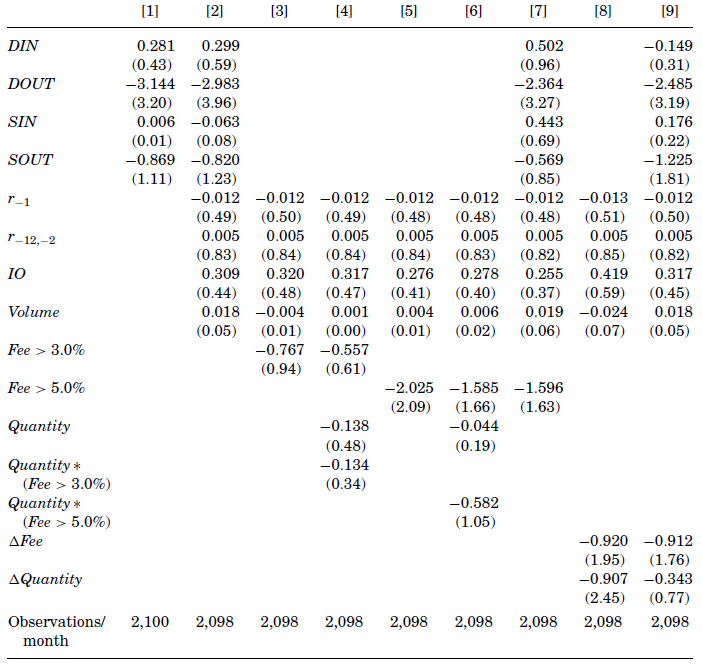
After divvying up shorting supply and demand into four categories, the authors run some regressions to determine what drives future stock returns.
DOUT, which represents the clear cut case where the demand curve has shifted outward, shows a significant ability to predict future return. Average abnormal returns for stocks experiencing an outward shift in DOUT are -2.983% in the following month (t =3.96). The result for other supply/demand shifts are weak.

The results are hypothetical results and are NOT an indicator of future results and do NOT represent returns that any investor actually attained. Indexes are unmanaged, do not reflect management or trading fees, and one cannot invest directly in an index. Additional information regarding the construction of these results is available upon request.
The results certainly seem to suggest that the primary driver behind excess future returns are related to increases in short sell demand.
So how can we make some money on this empirical result?
The authors perform the following analysis:
- Form portfolios using the four quadrant classifications defined above: demand in (DIN), demand out (DOUT), supply in (SIN), and supply out (SOUT).
- Buy stocks that have demand shifts inward and short stocks that have demand shifts outward. (DIN–DOUT)
- A similar trading strategy is to buy stocks that have supply shifts inward and short stocks that have supply shift outward. (SIN–SOUT)

The results are hypothetical results and are NOT an indicator of future results and do NOT represent returns that any investor actually attained. Indexes are unmanaged, do not reflect management or trading fees, and one cannot invest directly in an index. Additional information regarding the construction of these results is available upon request.
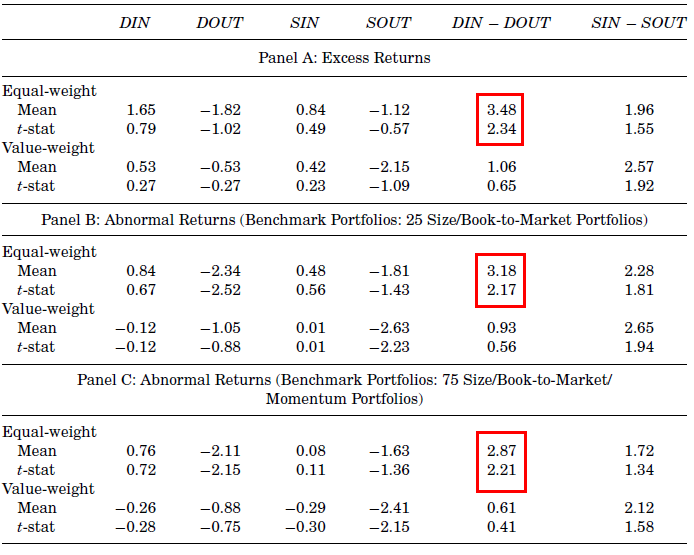
For an equal weighted portfolio, DOUT stocks earn average (equal-weight) abnormal returns in the subsequent month of -2.34% per month when benchmarked relative to size/book-to-market portfolios and -2.11% per month when benchmarked relative to size/book-to-market/momentum portfolios.
The trading strategy of buying stocks that have demand shifts inward and shorting stocks that have demand shifts outward (DIN–DOUT) yields a large and statistically significant return of around 3% per month in each panel of equal-weight returns. All other portfolios show suggestive, but statistical weak results.
Size certainly seems to matter in these trading strategies: Equal-weight portfolios show significant and positive returns, while value-weight portfolios have weak results. As mentioned in the paper, it is more likely that private information is affecting small caps abnormal returns relative to large stocks abnormal returns, because of inherent information asymmetries. However, an interesting note in the paper suggests that extending the holding period to 2 months (from 1 month), causes the value-weight DOUT results to be strongly negative and significant.
The authors perform a battery of additional tests to investigate where the extreme abnormal returns are coming from in the DOUT portfolio. In the end they conclude that DOUT simply represents smart investors piling in to short stocks that are extremely overvalued.
Investment Strategy:
- Access data on real-time shorting demand and supply (this is a difficult component of this trading strategy)
- Keep the list of securities below NYSE median market capitalization breakpoint at hand (strategy works best in smaller names)
- Watch the change in fees and trading quantity, when you see an increase, especially a significant increase, in both fee and trading quantity (DOUT), short the stock.
- Wait for the stock price decline and make money (~3% a month).
Commentary:
Unfortunately, the fees to run a short book are insanely high; the actual cost behind this dedicated short strategy may be unbearable and it may kill the returns. The authors even note that “the return to this strategy net of shorting costs, commissions, and price pressure is estimated to be about 4.5% per year”.
Another interesting aspect of this paper is the time period–1999 to 2003. This time period includes the tech bubble and the tech blow-up. After analyzing multiple long/short systems throughout this time period, it is very apparent that “something was different” during that manic episode in stock market history. I’m not sure if this special period biases the results, but my guess is that the time period under analysis is outside the range of ‘normal,’ which suggests the results should be taken with a grain of salt.
Anyway, with the advent of the AQS marketplace http://www.tradeaqs.com/, where we can now see real-time market information in the securities lending market, the ability to implement a “DOUT” trading strategy is much more realistic. My guess is that prop desks and prime brokerages of the past (and currently) found ways to trade on short lending information in real-time and front-ran all of our trades–hopefully, AQS will level the playing field.
About the Author: Wesley Gray, PhD
—
Important Disclosures
For informational and educational purposes only and should not be construed as specific investment, accounting, legal, or tax advice. Certain information is deemed to be reliable, but its accuracy and completeness cannot be guaranteed. Third party information may become outdated or otherwise superseded without notice. Neither the Securities and Exchange Commission (SEC) nor any other federal or state agency has approved, determined the accuracy, or confirmed the adequacy of this article.
The views and opinions expressed herein are those of the author and do not necessarily reflect the views of Alpha Architect, its affiliates or its employees. Our full disclosures are available here. Definitions of common statistics used in our analysis are available here (towards the bottom).
Join thousands of other readers and subscribe to our blog.


