Identifying Overvalued Equity
- Messod Beneish and Craig Nichols
- A version of the paper can be found here.
- Live implementation data can be found at Empirical Finance Data™ (Expected Q2 2011)
Abstract:
We develop a profile of overvalued equity, and show that firms meeting this profile experience abnormal stock returns net of transaction costs of -22 to -25 percent over the twelve months following portfolio formation. We show our model is distinct from predictors proposed in prior work, and our results robust to alternative measurements of expected returns. We also show that overvaluation is not confined to small firms and that institutions do not trade as if they identify overvalued equity. The profitable predictability we document suggests a pricing anomaly relating to the 2.5% of the firms in the population that our model identifies as substantially overvalued. Although we believe markets are generally efficient within the bounds of transaction costs, our evidence suggests that violations of minimally rational use of publicly available information do occur. To the extent that anomalies disappear or attenuate once documented in the literature (Doukas et al. 2002, Schwert 2003), our results are of interest to financial economists and investors.
Data Sources:
Compustat, CRSP, Spectrum, and SEC documents. The sample period covers 1993-2004 and customarily deletes financial firms, very small firms, and those with incomplete data. Return data is obtained from CRSP and data on restatements comes from Audit Analytics.
Discussion:
We’ve covered this paper in the past (in now extinct venues), but with the relaunch of our blog/data services (launch Q2), demand from long-time followers, and a desire to highlight one of the more compelling papers we have seen, we decided that an updated post on the “O-score” made sense. And plus, a dedicated reader told us that the O-score paper triggered his “O-face”…whatever that means…
So on with the show.
Why should we care about overvalued equity? If prices are high, everyone is happy, right?
Well, here are a few reasons why overpriced assets may not be a good thing for society and the markets:
- Overpricing erodes integrity of prices and their decision-making information content. For example, if I’m pricing a private business sale I can no longer look to the markets to know what the ‘right price’ might be. This lack of price information means I now have to engage in costly price discovery efforts, which could have been avoided if prices were generally reliable.
- Regulators dive in to fix the markets, which often leads to costly regulations that may not be necessary had the market structures been set up correctly in the first place.
- Employee and business contracts tied to stock price performance are inefficient and often unfair. For example, consider a firm that establishes compensation based on stock prices. The firm then hires a manager that decides to engage in fraudulent long-term value destroying activity; however, because equity becomes overvalued in short-term, the manager might take home a huge payday, even though he destroyed long-term value (bankers are a good example of this).
- Encourages managers to engage in value-destroying activity (described below)
Michael Jensen argued in a 2005 paper that managers of firms with overvalued equity are tempted to engage in long-term value-destruction. Jenson outlines the profile for a typical overvalued firm with poor managers:
- Weak fundamental performance
- High likelihood of earnings overstatement
- History of acquisitions
- Excessive investment
- Excessive equity issuance
- Unrealistic market expectations
A natural trading strategy is to simply see if Jenson’s theory makes sense: do overvalued firms with crappy managers actually underperform the markets expectations?
In order to address the question, the authors need to determine how to empirically test Jenson’s theory.
Here is how they do it:
1. Fundamental performance:
- Look at cash flows from operations–cash is king and cannot be manipulated via accrual accounting tricks
- Calculate a PROBM score from the PROBM model outlined in Beneish 1999. This model is the standard for predicting which firms will engage in earnings manipulation and fraud. Below are the regression estimates to use (or just use our data services when we launch them in a few months).
The results are hypothetical results and are NOT an indicator of future results and do NOT represent returns that any investor actually attained. Indexes are unmanaged, do not reflect management or trading fees, and one cannot invest directly in an index. Additional information regarding the construction of these results is available upon request.
3. History of acquisitions:
- Look at past history of acquisition activity–simple.
4. Excess equity issuance and excessive investing:
- Look at recent equity issuance.
- Look at recent history of increased hiring and capital investment.
5. Unrealistic market expectations:
- Look at sales growth, which has been identified in previous academic research as a hallmark of “glamour stocks.” Moreover, evidence from La Porta , Lakonishok, Shleifer, and Vishny (1997) suggest that Wall Street is systematically surprised by high sales growth firms that “magically” stop producing 50% growth YoY.
Construct the O-score (1 point per component):
a) Falls in the top PROBM quintile
b) Falls in the bottom cash flow-to-total assets quintile
c) Falls in the top sales growth quintile
d) Has engaged in a merger or acquisition in the last five years
e) Has issued equity in excess of the industry median in the last two years
5=Most OVERVALUED; 0=Least OVERVALUED
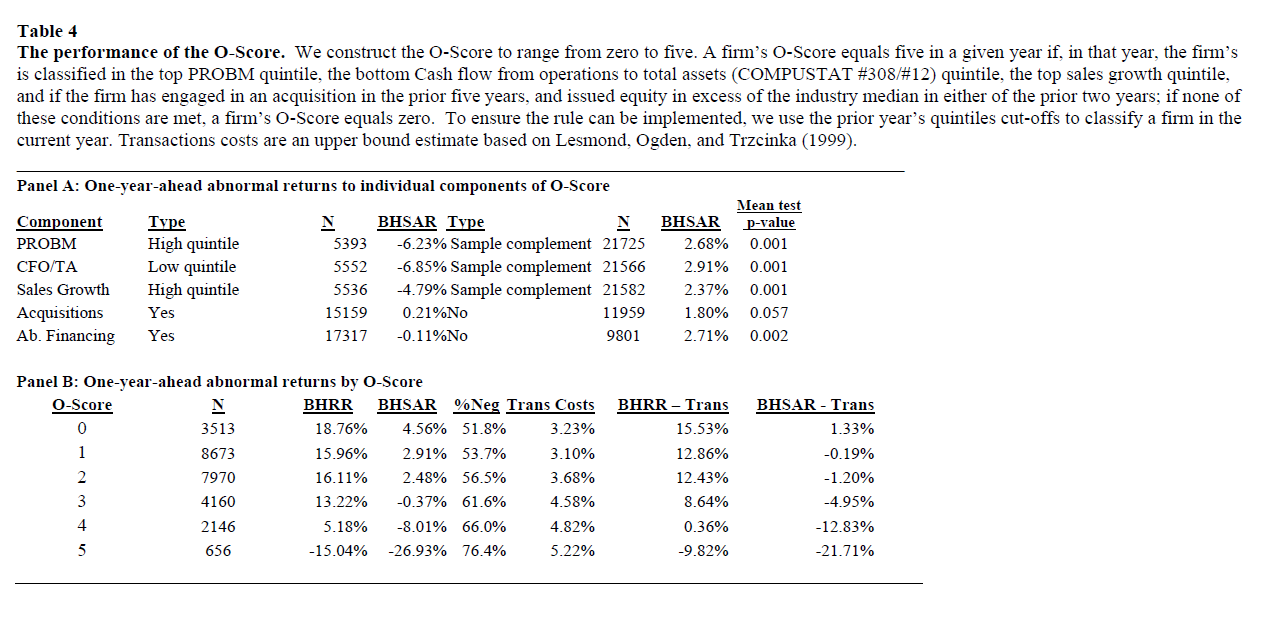
How does the O-score perform?
Take a look for yourself:

The results are hypothetical results and are NOT an indicator of future results and do NOT represent returns that any investor actually attained. Indexes are unmanaged, do not reflect management or trading fees, and one cannot invest directly in an index. Additional information regarding the construction of these results is available upon request.
Before costs, high O-score firms earn an average abnormal return of -27% a year and almost 76.4% of them are negative–incredible.
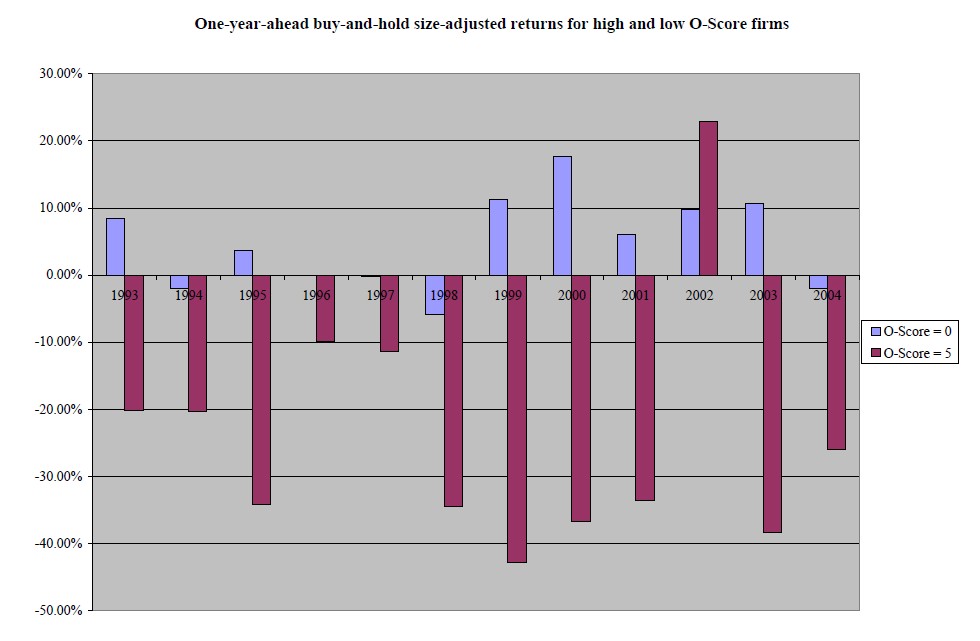
For the quantitatively challenged, here are some pictures:

The results are hypothetical results and are NOT an indicator of future results and do NOT represent returns that any investor actually attained. Indexes are unmanaged, do not reflect management or trading fees, and one cannot invest directly in an index. Additional information regarding the construction of these results is available upon request.
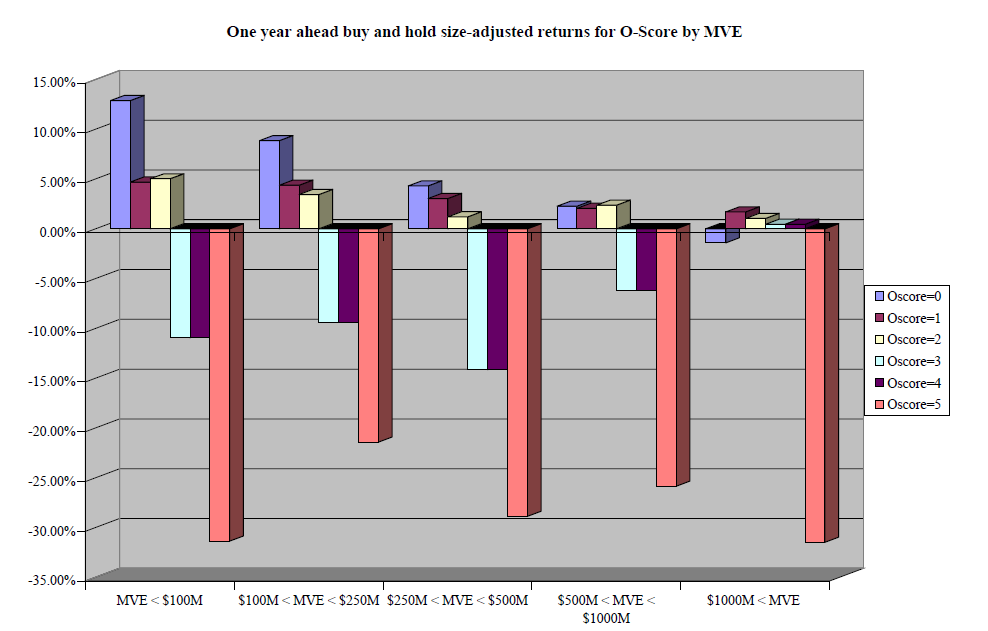
Curious if it works across market caps? More finance porn for your viewing pleasure:

The results are hypothetical results and are NOT an indicator of future results and do NOT represent returns that any investor actually attained. Indexes are unmanaged, do not reflect management or trading fees, and one cannot invest directly in an index. Additional information regarding the construction of these results is available upon request.
Investment Strategy:
- Calculate O-score for all firms in your universe.
- Short highest O-score firms.
- Make money.
Commentary:
Unfortunately, personal experience paying insane fees to run a short book suggests that cost analysis for any short-book strategy is paramount. One must look closely at the transaction costs involved in this dedicated short strategy. As one would expect, the authors show that short costs definitely blunt the investment returns of the O-score strategy. Nonetheless, transaction costs certainly don’t eliminate the effect (still looking at -20%+ returns on the table). By all means–go for it.
Now that you are probably salivating at the chance of creating the ultimate short book, the next phase in the process is to determine your capabilities to calculate O-score–not a simple task. The O-score strategy is EXTREMELY data intensive and requires some serious time, effort, and access to specialized data resources. Luckily, we are developing a O-score module for our new data services site, which will be available for paying subscribers (we are “democratizing quant,” so fees will be very low relative to value provided). Of course, if you are more adventurous, feel free to try the O-score trading strategy on your own.
About the Author: Wesley Gray, PhD
—
Important Disclosures
For informational and educational purposes only and should not be construed as specific investment, accounting, legal, or tax advice. Certain information is deemed to be reliable, but its accuracy and completeness cannot be guaranteed. Third party information may become outdated or otherwise superseded without notice. Neither the Securities and Exchange Commission (SEC) nor any other federal or state agency has approved, determined the accuracy, or confirmed the adequacy of this article.
The views and opinions expressed herein are those of the author and do not necessarily reflect the views of Alpha Architect, its affiliates or its employees. Our full disclosures are available here. Definitions of common statistics used in our analysis are available here (towards the bottom).
Join thousands of other readers and subscribe to our blog.


