Mispricing of Dual-Class Shares: Profit Opportunities, Arbitrage, and Trading
- Paul H. Schultz and Sophia Shive
- A version of the paper can be found here.
- We maintain live datasets for this strategy and can pipe customized products via our Data site infrastructure. If interested, contact us here.
Abstract:
This is the first paper to examine the microstructure of how mispricing is created and resolved. We study dual class-shares with equal cash-flow rights, and show that a simple trading strategy exploiting gaps between their prices appears to create abnormal profits after transactions costs. Trade data from TAQ shows that investors shift their trading patterns to take advantage of gaps. Contrary to common perception, long-short arbitrage plays a minor part in eliminating gaps, and one-sided trades correct most of them. We also show that the more liquid share class is usually responsible for the price discrepancies. Our findings have implications for the literature on risky arbitrage and asset pricing more generally.
Data Sources:
The authors compile a list of companies with two classes of stock using CRSP/Compustat during the period 1993-2006. Next, they verify that cash flow rights are equivalent and determine how voting rights differ. Their sample ends up being exactly 100 companies.
Discussion:
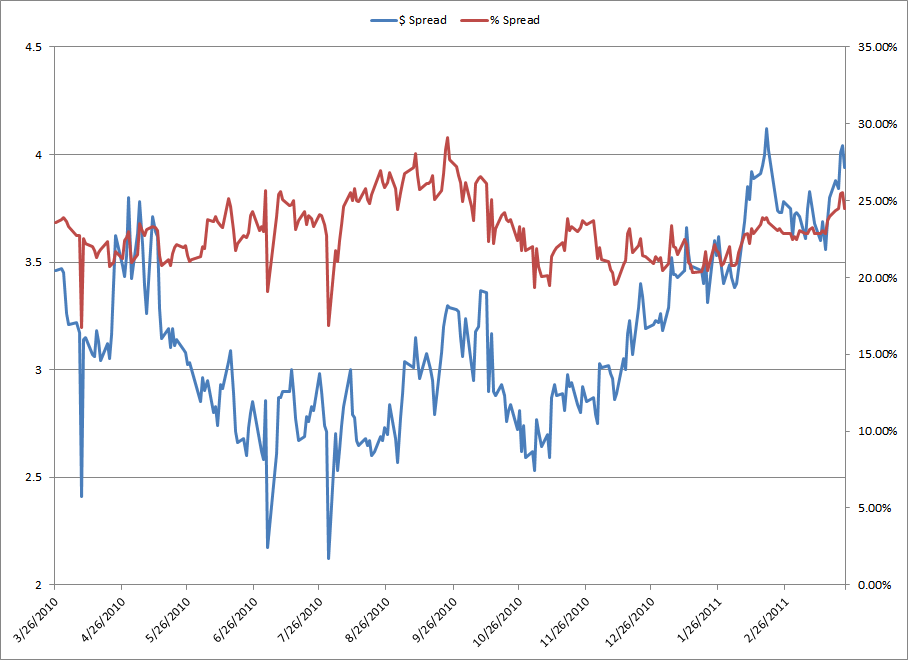
Dual-shares can mean a lot of things to a lot of people, but in the context of arbitrage trading, these shares are defined as shares with equal cash flow rights, but different voting rights (sometimes the cash-flow rights are not on a 1 for 1 basis, but this can be accounted for in the trading strategy). Here is an example discussed on Chipotle: click here or here. And below is a live spread of LEN and LEN.B:

The results are hypothetical results and are NOT an indicator of future results and do NOT represent returns that any investor actually attained. Indexes are unmanaged, do not reflect management or trading fees, and one cannot invest directly in an index. Additional information regarding the construction of these results is available upon request.
Data Source: Capital IQ.
Why would there be a divergence in price for an asset that has matching cash-flows?
There are a few “rational” reasons for divergence:
- Liquidity premium–one class of stock is a day-trader’s dream; the other class is only loved by widows and penny-stock newsletter authors.
- Voting rights–in certain cases, voting rights may actually have real effects on the net present value of the cash flows between shares.
- Limits of arbitrage–short-selling constraints, bid/ask spreads, impact costs, and so forth.
So how do these concepts hold up against the data?
A “duh” test to see if rational reasons explain all divergence between shares is easy: look at spreads over time. If markets are rationally pricing divergence costs, the spreads between dual-class shares should stay relatively stable on a day-to-day basis. Or in other words: Why would the liquidity and voting value of shares change wildly from one day to the next?

The results are hypothetical results and are NOT an indicator of future results and do NOT represent returns that any investor actually attained. Indexes are unmanaged, do not reflect management or trading fees, and one cannot invest directly in an index. Additional information regarding the construction of these results is available upon request.
The figure below highlights just how wide the divergence can be. In this scenario, the authors examine the daily stock price of Gray Television. In 2002 and 2003 the spread goes one way, reverts in 2004-2006, then goes back to the original spread.
We know the voting rights didn’t change, so was it simply a liquidity premium that decided to bounce between difference classes of shares–one day Class A share says to Class B share, “Hey bud, you take on the day-traders today, I’m sleeping.” Next day Class B says to Class A, “Yo A-dawg, I’m chilling today, you attract all the liquidity today.” …doesn’t seem like a likely scenario that shares are talking to each other from day-to-day. Then again, pigs can fly.
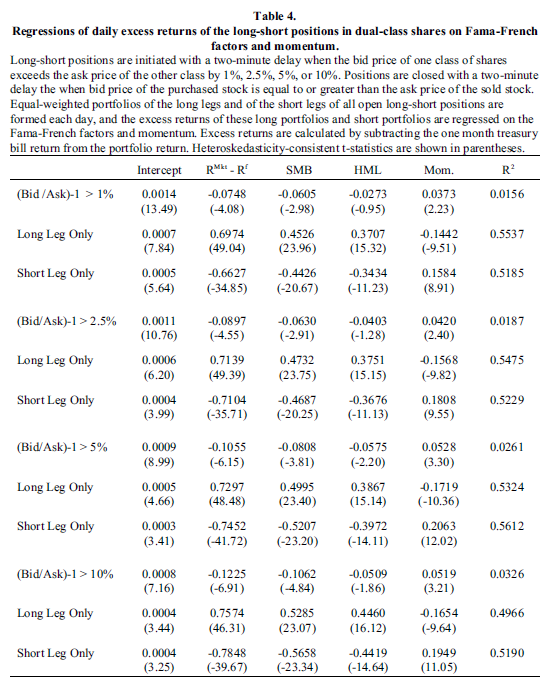
Operating under the assumption that there may be a potential mispricing effect occurring in dual-class shares, the natural question becomes: Can we make any money trading this strategy? Table 4 sheds some light on this basis question.
Focus on column 4–the “intercept” estimate column. The intercept estimate (or “alpha” estimate) represents the average excess “abnormal” return an investor would expect to receive after controlling for market, size, value, and moment risk, on a daily basis. For example, if you performed an intra-day strategy that bought when the spreads were greater than 1% and closed the trade when the spread collapsed back to 0%, and rebalanced daily to equally invest in all of these situations, your daily abnormal expected return would run around 14bp, which equates to a precise compounded annual return of “a lot.”

The results are hypothetical results and are NOT an indicator of future results and do NOT represent returns that any investor actually attained. Indexes are unmanaged, do not reflect management or trading fees, and one cannot invest directly in an index. Additional information regarding the construction of these results is available upon request.
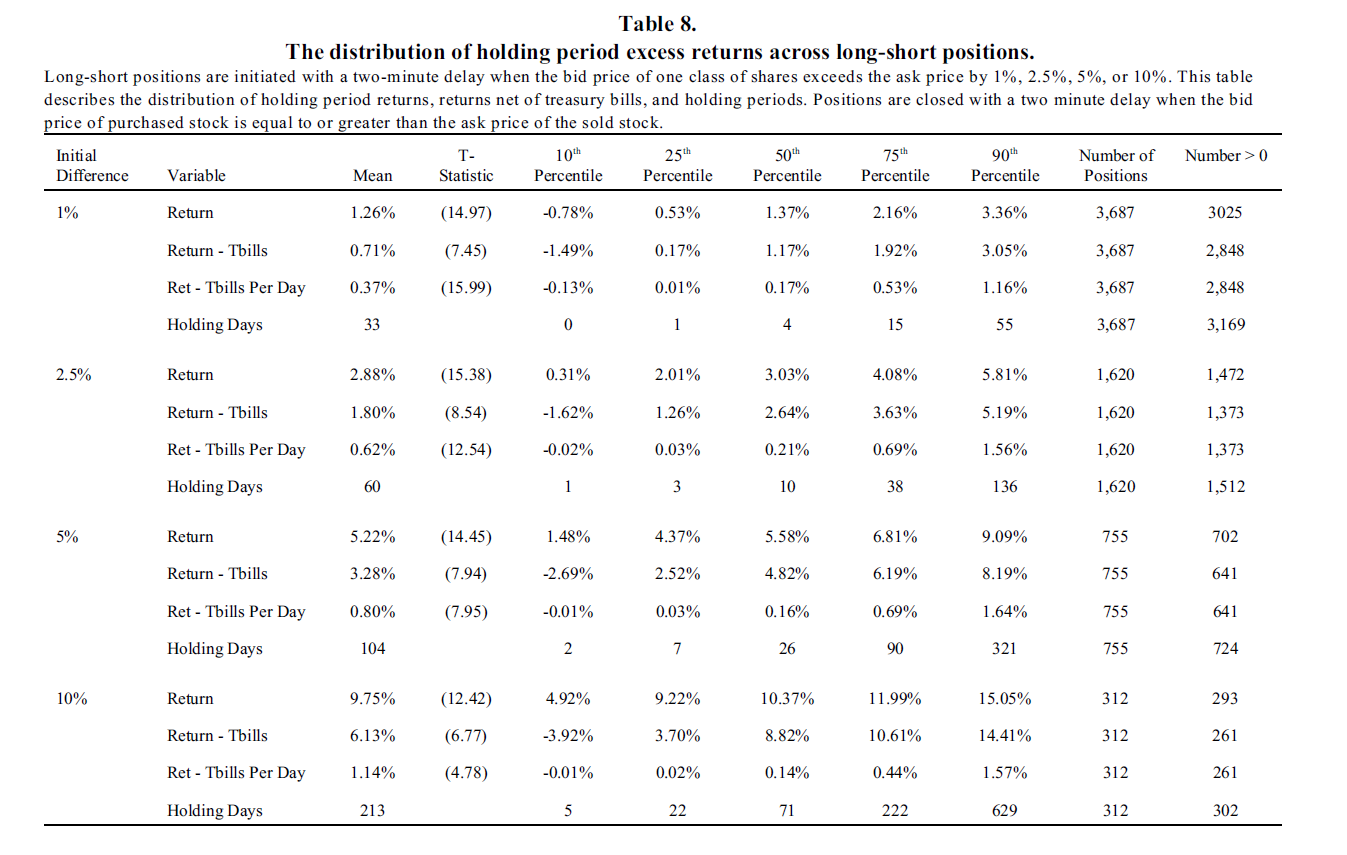
If you’re not a big fan of running noisy daily excess return regressions against a whole bunch of “controlling for risk” factors, you may want to check out Table 8. Most–scratch that–ALL traders I know of in the real world have a benchmark called a “P&L,” which roughly translates into a benchmark that simply asks, “Did you make money?” Or, “Did you lose money?” Table 8 shows us exactly what the L/S dual-class arbitrage strategy can churn on an absolute basis and on a tbills-adjusted, or “after cost of funding” basis. The table also highlights the returns for various holding periods. The downside of this table is that we are only seeing what the ‘average’ trade looks like, but we aren’t seeing what a ‘portfolio strategy of dual-class shares’ might look like (that was Table 4).

The results are hypothetical results and are NOT an indicator of future results and do NOT represent returns that any investor actually attained. Indexes are unmanaged, do not reflect management or trading fees, and one cannot invest directly in an index. Additional information regarding the construction of these results is available upon request.
Pretty interesting stuff: the average trade across strategy is typically positive (e.g., 3025/3687, or 82% of the 1% initial difference trades held to close are profitable)
Investment Strategy:
- Identify a list of dual-class shares.
- Devise a “spread divergence” trading strategy with a variety of rules.
- Make money.
Commentary:
This is truly an epic paper–not because I really find the strategy unique or the concepts 100% compelling, but because of the work these researchers put in to produce this paper! Holy cow. The raw data collection and programming to produce the tables and figures in this paper would take 6 months to 1 year just to build! God bless ’em, because now Empirical Finance Blog readers can benefit from this knowledge.
One aside on trading costs. Trading this strategy in a intra-day fashion is absolutely suicidal for the retail investor, and likely unsustainable for 99% of professional firms out there. That said, you don’t have to implement every single trade to be successful. One takeaway from this research is that the average dual-class share trade is going to work out. So save yourself some insane transaction costs, pick your favorite diverging dual-class pair trade, and hope for the best. Heck, according to table 8, the mean return to buying dual-class spreads when they are greater than 10% and holding to close is 9.75%, with an average holding period of 213 days–I’ll take it.
About the Author: Wesley Gray, PhD
—
Important Disclosures
For informational and educational purposes only and should not be construed as specific investment, accounting, legal, or tax advice. Certain information is deemed to be reliable, but its accuracy and completeness cannot be guaranteed. Third party information may become outdated or otherwise superseded without notice. Neither the Securities and Exchange Commission (SEC) nor any other federal or state agency has approved, determined the accuracy, or confirmed the adequacy of this article.
The views and opinions expressed herein are those of the author and do not necessarily reflect the views of Alpha Architect, its affiliates or its employees. Our full disclosures are available here. Definitions of common statistics used in our analysis are available here (towards the bottom).
Join thousands of other readers and subscribe to our blog.

